This manuscript is still work in progress
This manuscript (permalink) was automatically generated from fmsabatini/sPlotOpen_Manuscript@2d00686 on July 5, 2021.
![]() Francesco Maria Sabatini1,2,†,
Francesco Maria Sabatini1,2,†,
![]() Jonathan Lenoir3,†,
Jonathan Lenoir3,†,
![]() Tarek Hattab4,
Tarek Hattab4,
![]() Elise Aimee Arnst5,
Elise Aimee Arnst5,
![]() Milan Chytrý6,
Milan Chytrý6,
![]() Jürgen Dengler1,7,8,
Patrice De Ruffray9,
Jürgen Dengler1,7,8,
Patrice De Ruffray9,
![]() Stephan M. Hennekens10,
Stephan M. Hennekens10,
![]() Ute Jandt1,2,
Florian Jansen11,
Ute Jandt1,2,
Florian Jansen11,
![]() Borja Jiménez-Alfaro12,
Borja Jiménez-Alfaro12,
![]() Jens Kattge13,
Aurora Levesley14,
Jens Kattge13,
Aurora Levesley14,
![]() Valério D. Pillar15,
Valério D. Pillar15,
![]() Oliver Purschke16,
Brody Sandel17,
Fahmida Sultana18,
Oliver Purschke16,
Brody Sandel17,
Fahmida Sultana18,
![]() Tsipe Aavik19,
Tsipe Aavik19,
![]() Svetlana Aćić20,
Svetlana Aćić20,
![]() Alicia T.R. Acosta21,
Alicia T.R. Acosta21,
![]() Emiliano Agrillo22,
Emiliano Agrillo22,
![]() Miguel Alvarez23,
Iva Apostolova24,
Miguel Alvarez23,
Iva Apostolova24,
![]() Mohammed A.S. Arfin Khan25,
Luzmila Arroyo26,
Mohammed A.S. Arfin Khan25,
Luzmila Arroyo26,
![]() Fabio Attorre27,
Fabio Attorre27,
![]() Isabelle Aubin28,
Arindam Banerjee29,
Marijn Bauters30,31,
Isabelle Aubin28,
Arindam Banerjee29,
Marijn Bauters30,31,
![]() Yves Bergeron32,
Yves Bergeron32,
![]() Erwin Bergmeier33,
Erwin Bergmeier33,
![]() Idoia Biurrun34,
Idoia Biurrun34,
![]() Anne D. Bjorkman35,36,
Anne D. Bjorkman35,36,
![]() Gianmaria Bonari37,
Gianmaria Bonari37,
![]() Viktoria Bondareva38,
Viktoria Bondareva38,
![]() Jörg Brunet39,
Jörg Brunet39,
![]() Andraž Čarni40,41,
Andraž Čarni40,41,
![]() Laura Casella42,
Laura Casella42,
![]() Luis Cayuela43,
Tomáš Černý44,
Luis Cayuela43,
Tomáš Černý44,
![]() Victor Chepinoga45,
Victor Chepinoga45,
![]() János Csiky46,
Renata Ćušterevska47,
János Csiky46,
Renata Ćušterevska47,
![]() Els De Bie48,
André Luis de Gasper49,
Els De Bie48,
André Luis de Gasper49,
![]() Michele De Sanctis27,
Panayotis Dimopoulos50,
Michele De Sanctis27,
Panayotis Dimopoulos50,
![]() Jiri Dolezal51,
Tetiana Dziuba52,
Jiri Dolezal51,
Tetiana Dziuba52,
![]() Mohamed Abd El-Rouf Mousa El-Sheikh53,54,
Brian Enquist55,
Mohamed Abd El-Rouf Mousa El-Sheikh53,54,
Brian Enquist55,
![]() Jörg Ewald56,
Farideh Fazayeli57,58,
Jörg Ewald56,
Farideh Fazayeli57,58,
![]() Richard Field59,
Manfred Finckh60,
Richard Field59,
Manfred Finckh60,
![]() Sophie Gachet61,
Sophie Gachet61,
![]() Antonio Galán-de-Mera62,63,64,
Antonio Galán-de-Mera62,63,64,
![]() Emmanuel Garbolino65,
Emmanuel Garbolino65,
![]() Hamid Gholizadeh66,
Hamid Gholizadeh66,
![]() Melisa Giorgis67,
Melisa Giorgis67,
![]() Valentin Golub68,
Valentin Golub68,
![]() Inger Greve Alsos69,
John-Arvid Grytnes70,
Inger Greve Alsos69,
John-Arvid Grytnes70,
![]() Gregory Richard Guerin71,
Gregory Richard Guerin71,
![]() Alvaro G. Gutiérrez72,
Alvaro G. Gutiérrez72,
![]() Sylvia Haider1,2,
Sylvia Haider1,2,
![]() Mohamed Z. Hatim73,74,
Mohamed Z. Hatim73,74,
![]() Bruno Hérault75,76,77,
Guillermo Hinojos Mendoza78,
Bruno Hérault75,76,77,
Guillermo Hinojos Mendoza78,
![]() Norbert Hölzel79,
Norbert Hölzel79,
![]() Jürgen Homeier80,
Wannes Hubau81,82,
Adrian Indreica83,
John A.M. Janssen84,
Birgit Jedrzejek79,
Jürgen Homeier80,
Wannes Hubau81,82,
Adrian Indreica83,
John A.M. Janssen84,
Birgit Jedrzejek79,
![]() Anke Jentsch85,
Anke Jentsch85,
![]() Norbert Jürgens60,
Zygmunt Kącki86,
Jutta Kapfer87,
Norbert Jürgens60,
Zygmunt Kącki86,
Jutta Kapfer87,
![]() Dirk Nikolaus Karger88,
Dirk Nikolaus Karger88,
![]() Ali Kavgacı89,
Ali Kavgacı89,
![]() Elizabeth Kearsley90,
Elizabeth Kearsley90,
![]() Michael Kessler91,
Michael Kessler91,
![]() Larisa Khanina92,
Timothy Killeen93,
Andrey Korolyuk94,
Larisa Khanina92,
Timothy Killeen93,
Andrey Korolyuk94,
![]() Holger Kreft95,
Holger Kreft95,
![]() Hjalmar S. Kühl1,96,
Hjalmar S. Kühl1,96,
![]() Anna Kuzemko97,
Anna Kuzemko97,
![]() Flavia Landucci6,
Flavia Landucci6,
![]() Attila Lengyel98,
Attila Lengyel98,
![]() Frederic Lens99,100,
Frederic Lens99,100,
![]() Débora Vanessa Lingner101,
Hongyan Liu102,
Débora Vanessa Lingner101,
Hongyan Liu102,
![]() Tatiana Lysenko103,104,105,
Tatiana Lysenko103,104,105,
![]() Miguel D. Mahecha1,106,
Miguel D. Mahecha1,106,
![]() Corrado Marcenò6,34,
Corrado Marcenò6,34,
![]() Vasiliy Martynenko107,
Vasiliy Martynenko107,
![]() Jesper Erenskjold Moeslund108,
Jesper Erenskjold Moeslund108,
![]() Abel Monteagudo Mendoza109,110,
Abel Monteagudo Mendoza109,110,
![]() Ladislav Mucina111,112,
Ladislav Mucina111,112,
![]() Jonas V. Müller113,
Jonas V. Müller113,
![]() Jérôme Munzinger114,
Alireza Naqinezhad115,
Jérôme Munzinger114,
Alireza Naqinezhad115,
![]() Jalil Noroozi116,
Jalil Noroozi116,
![]() Arkadiusz Nowak117,118,
Viktor Onyshchenko119,
Arkadiusz Nowak117,118,
Viktor Onyshchenko119,
![]() Gerhard E. Overbeck120,
Gerhard E. Overbeck120,
![]() Meelis Pärtel19,
Meelis Pärtel19,
![]() Aníbal Pauchard121,122,
Aníbal Pauchard121,122,
![]() Robert K. Peet123,
Robert K. Peet123,
![]() Josep Peñuelas124,125,
Josep Peñuelas124,125,
![]() Aaron Pérez-Haase126,127,
Tomáš Peterka6,
Aaron Pérez-Haase126,127,
Tomáš Peterka6,
![]() Petr Petřík128,
Petr Petřík128,
![]() Gwendolyn Peyre129,
Gwendolyn Peyre129,
![]() Oliver L. Phillips14,
Vadim Prokhorov130,
Oliver L. Phillips14,
Vadim Prokhorov130,
![]() Valerijus Rašomavičius131,
Valerijus Rašomavičius131,
![]() Rasmus Revermann132,133,
Rasmus Revermann132,133,
![]() Gonzalo Rivas-Torres134,
John S. Rodwell135,
Gonzalo Rivas-Torres134,
John S. Rodwell135,
![]() Eszter Ruprecht136,
Eszter Ruprecht136,
![]() Solvita Rūsiņa137,
Cyrus Samimi138,
Solvita Rūsiņa137,
Cyrus Samimi138,
![]() Marco Schmidt139,
Marco Schmidt139,
![]() Franziska Schrodt59,
Hanhuai Shan140,
Franziska Schrodt59,
Hanhuai Shan140,
![]() Pavel Shirokikh107,
Pavel Shirokikh107,
![]() Jozef Šibík141,
Jozef Šibík141,
![]() Urban Šilc142,
Petr Sklenář143,
Urban Šilc142,
Petr Sklenář143,
![]() Željko Škvorc144,
Ben Sparrow145,
Željko Škvorc144,
Ben Sparrow145,
![]() Marta Gaia Sperandii21,146,
Zvjezdana Stančić147,
Marta Gaia Sperandii21,146,
Zvjezdana Stančić147,
![]() Jens-Christian Svenning148,
Zhiyao Tang102,
Cindy Q. Tang149,
Ioannis Tsiripidis150,
Jens-Christian Svenning148,
Zhiyao Tang102,
Cindy Q. Tang149,
Ioannis Tsiripidis150,
![]() Kim André Vanselow151,
Rodolfo Vásquez Martínez109,
Kiril Vassilev24,
Kim André Vanselow151,
Rodolfo Vásquez Martínez109,
Kiril Vassilev24,
![]() Eduardo Vélez-Martin152,
Eduardo Vélez-Martin152,
![]() Roberto Venanzoni153,
Alexander Christian Vibrans101,
Cyrille Violle154,
Roberto Venanzoni153,
Alexander Christian Vibrans101,
Cyrille Violle154,
![]() Risto Virtanen1,155,156,
Henrik von Wehrden157,
Risto Virtanen1,155,156,
Henrik von Wehrden157,
![]() Viktoria Wagner158,
Donald A. Walker159,
Viktoria Wagner158,
Donald A. Walker159,
![]() Donald M. Waller160,
Hua-Feng Wang161,
Karsten Wesche1,162,163,
Donald M. Waller160,
Hua-Feng Wang161,
Karsten Wesche1,162,163,
![]() Timothy J.S. Whitfeld164,
Timothy J.S. Whitfeld164,
![]() Wolfgang Willner116,
Wolfgang Willner116,
![]() Susan K. Wiser5,
Susan K. Wiser5,
![]() Thomas Wohlgemuth165,
Sergey Yamalov166,
Thomas Wohlgemuth165,
Sergey Yamalov166,
![]() Martin Zobel19,
Martin Zobel19,
![]() Helge Bruelheide1,2
Helge Bruelheide1,2
✉ — To whom correspondence should be addressed: francesco.sabatini@botanik.uni-halle.de
† — These authors contributed equally to this work
sPlotOpen: a global vegetation plot database
Motivation: Assessing biodiversity status and trends in plant communities is critical for understanding, quantifying and predicting the effects of global change on ecosystems. Vegetation plots record the occurrence or abundance of all plant species co-occurring within delimited local areas. This allows species absences to be inferred, an information seldom provided by existing global plant datasets. Although many vegetation plots have been recorded, most are not available to the global research community. A recent initiative, called ‘sPlot’, compiled the first global vegetation plot database, and continues to grow and curate it. The sPlot database, however, is extremely unbalanced spatially, and is not open-access. Here, we address both these issues by (a) resampling the vegetation plots using several environmental variables as sampling strata (b) securing permission from data holders of 105 local-to-regional datasets to openly release data. We thus present sPlotOpen, the largest open-access dataset of vegetation plots ever released. sPlotOpen can be used to explore global patterns of diversity at the plant community level, as ground truth data in remote sensing applications, or as a baseline for biodiversity monitoring.
Main types of variable contained: Vegetation plots (n = 95,104) recording cover or abundance of naturally occurring vascular plant species within delimited areas. sPlotOpen contains three partially overlapping resampled datasets (~50,000 plots each), to be used as replicates in global analyses. Besides geographic location, date, plot size, biome, elevation, slope, aspect, vegetation type, naturalness, coverage of various vegetation layers and source dataset, plot-level data also include community-weighted means and variances of 18 plant functional traits from the ‘TRY’ database.
Spatial location and grain: Global, 0.01-40,000 m².
Time period and grain: 1888-2015, recording dates.
Major taxa and level of measurement: 42,677 vascular plant taxa, plot-level records.
Software format: Three main matrices (.csv), relationally linked.
Biodiversity, Biogeography, Big-data, Database, Functional traits, Macroecology, Vascular plants, Vegetation plots
Biodiversity is facing a global crisis. As many as 1 million species are currently threatened with extinction, the vast majority due to anthropogenic impacts such as land-use and climate change (1, 2). In addition, the rates of biodiversity homogenization and redistribution are accelerating (3, 4; 5). Biological assemblages are becoming progressively more similar to each other globally, as local and endemic species go extinct and are replaced by more widespread and competitive native or alien species (1; 5). Many terrestrial and marine species are also shifting their geographical distribution as a response to climate change (4). This has profound potential impacts on ecosystems and human health (6; 7).
Plant communities are no exception to this biodiversity crisis (8; 9; 5). This is particularly worrying since terrestrial vegetation accounts for 80% (450 Gt C) of the living biomass on Earth (10). Given the central role of vegetation in ecosystem productivity, structure, stability and functioning (9), assessing biodiversity status and trends in plant communities is paramount for other kingdoms of life and human societies alike.
Monitoring trends in plant biodiversity requires adequate data across a range of spatiotemporal scales (11, 12). Large independent collections of plant occurrence data do exist at the global or continental extent via the Botanical Information and Ecology Network (BIEN) (13), the Global Inventory of Floras and Traits (GIFT) (14) or the Global Biodiversity Information Facility (GBIF) (https://www.gbif.org/). However, these databases suffer from one or several of the following limitations: (1) imbalance towards tree species only; (2) lack of data on how individual plant species co-occur and interact locally to form plant communities; or (3) coarse spatial resolutions (e.g., one‐degree grid cells), which preclude intersection with high resolution remote sensing data and the assessment of biodiversity trends at the plant community level (15).
There is a long tradition among botanists and phytosociologists to record the cover or abundance of each plant species that occurs in a vegetation plot (here used as a synonym of ‘relevé’ or ‘quadrat’) of a given size (i.e. surface area) at a given time (e.g. 16). Compared to presence-only data, vegetation-plot data present many advantages. As all visible plant species are recorded, plots contain information on which plant species do, and do not co‐occur in the same locality at a given moment in time (17). This is important for testing hypotheses related to biotic interactions among plant species. Vegetation-plot data also provide crucial information on where and when a species was absent, therefore improving predictions from current species distribution models (18). Being spatially explicit, vegetation plots can be resurveyed through time to assess potential changes in plant species composition relative to a baseline (19; 20, 5). As they normally contain information on the relative cover or abundance of each species, vegetation plots are also more appropriate for detecting biodiversity changes than data representing only the occurrence of individual species (21, 22).
Globally, however, vegetation-plot data are very fragmented, as they typically stem from a myriad of local research and survey projects (23). These are fine-grained data (e.g., 1-10,000 m2) normally covering small spatial extents (e.g., 1-1,000 km2)(24). With their disparate sampling protocols, standards and taxonomic resolutions, aggregating and harmonizing vegetation plot data proves extremely challenging (25). It is not surprising, therefore, that these data are rarely used in global‐scale research on the biodiversity of plant communities (26; 27; 28).
The sPlot initiative tries to close this data gap. It consolidates numerous local to regional vegetation-plot datasets to create a harmonized and comprehensive global database of georeferenced terrestrial plant species assemblages (23). Established in 2013, sPlot (version 3) currently contains more than 1.9 million vegetation plots, and is fully integrated with the TRY database (29), from which it derives information on plant functional traits. The sPlot database is increasingly being used to study continental-to-global scale vegetation patterns (30, 31), such as the relative contribution of regional vs. local factors on the global patterns of fern richness (32), the mechanisms underlying the spread and abundance of native vs. invasive tree species (33), and worldwide trait–environment relationships in plant communities (25).
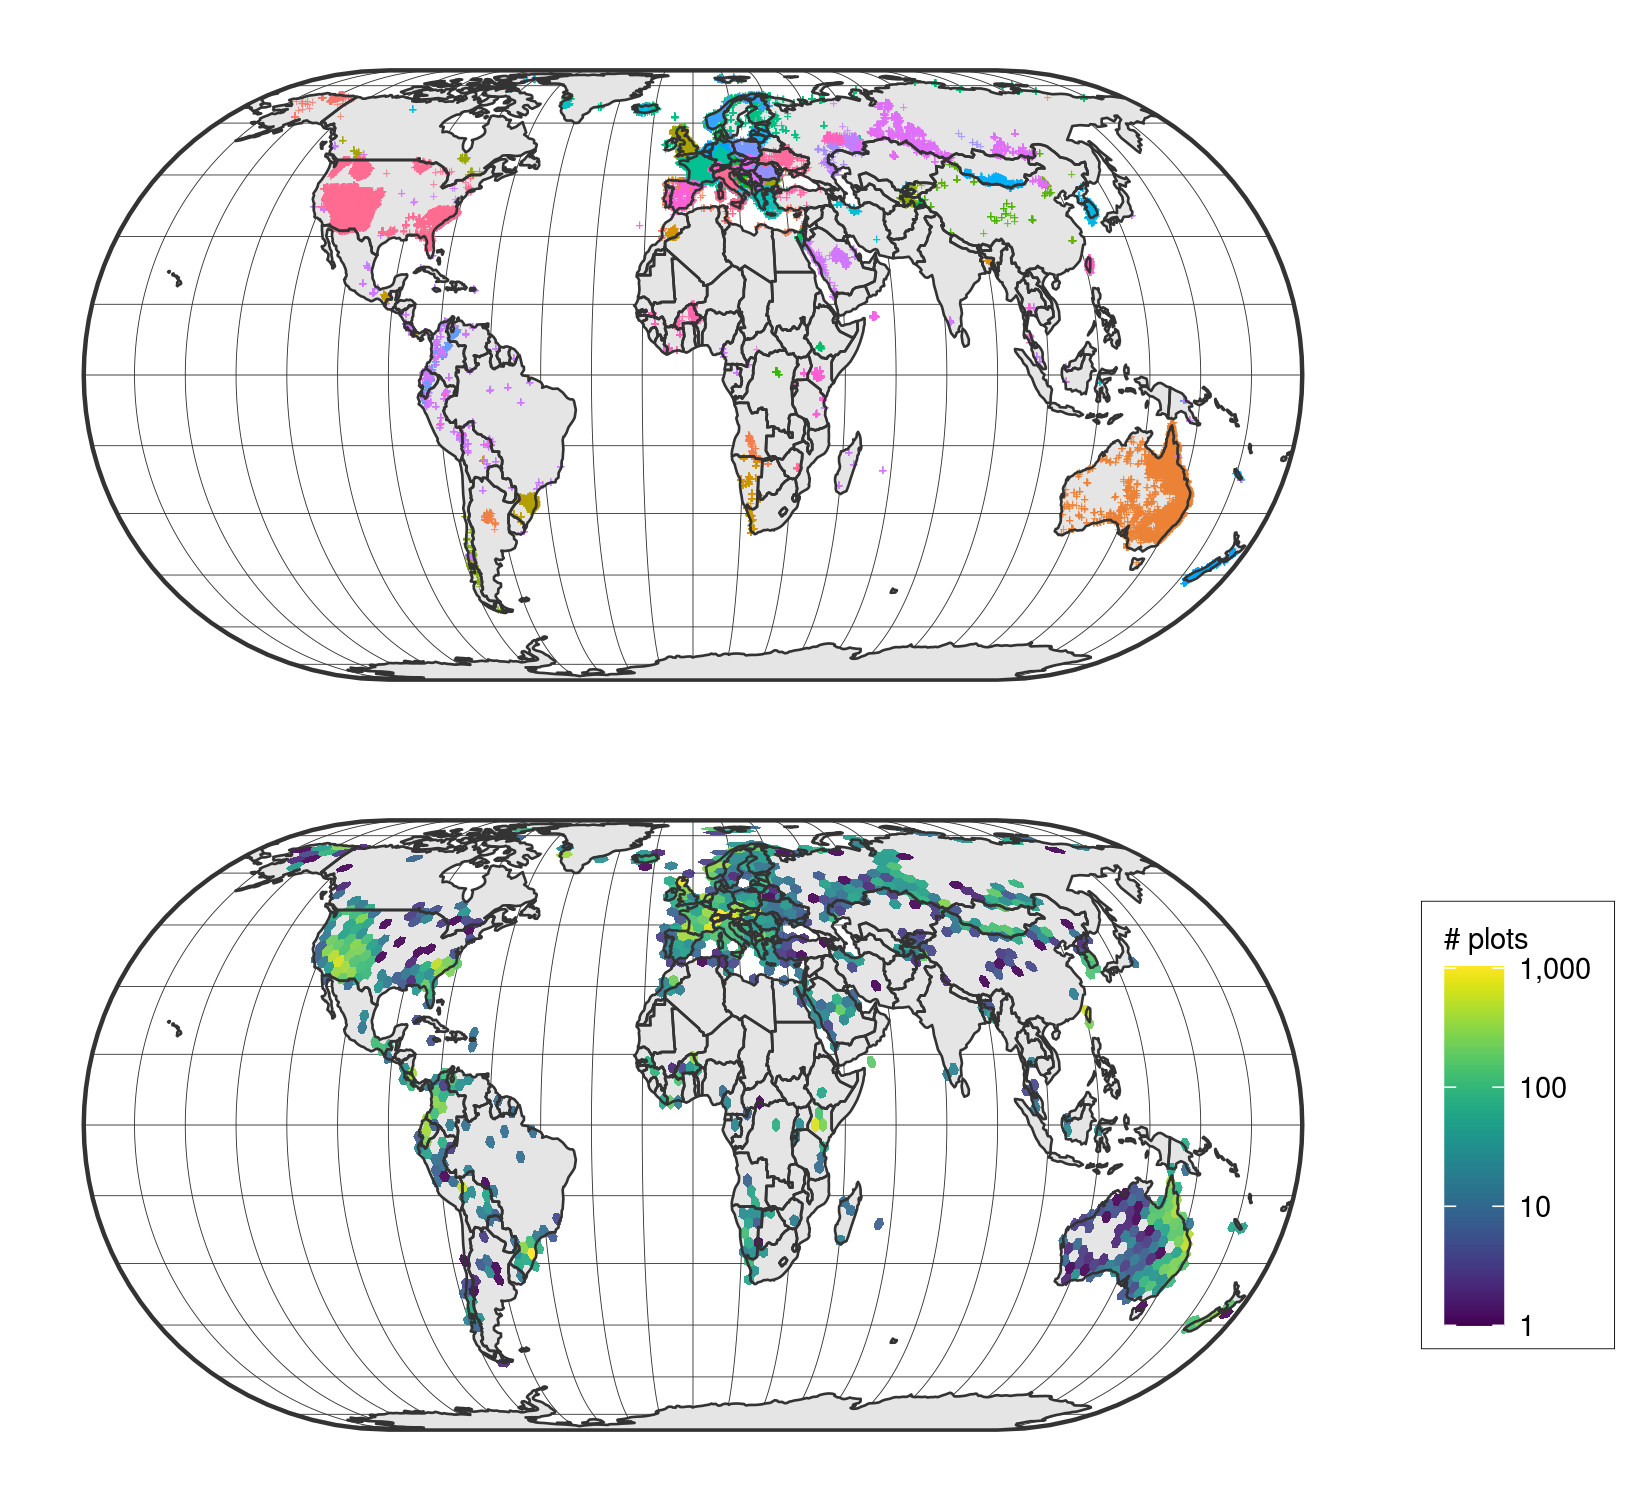
Yet, most of these data are not open-access. Here, we secured permission from data holders in the sPlot database to openly release a dataset composed of 95,104 vegetation plots. We selected the plots to release using a replicated environmental stratification, in order to represent the entire environmental space covered by the sPlot database. This maximises the benefits of releasing these data for a wide range of potential uses. The selected vegetation plots stem from 105 databases and span 114 countries (Figure 1). This resampled dataset (sPlotOpen - hereafter) is composed of: (1) plot-level information, including metadata and basic vegetation structure descriptors; (2) the vascular plant species composition of each vegetation plot, including species cover or abundance information when available; and (3) community-level functional information obtained by intersection with the TRY database (29).
sPlotOpen is specifically designed for global macroecological studies, e.g., the exploration of functional diversity patterns at the plant community scale with continental-to-global extent. We expect, however, that sPlotOpen might likewise prove useful to answer a range of different questions, related for instance to species co-occurrence patterns, the definition of species pools, the link between regional vs. local determinants of species diversity, or the niche overlap between co-occurring species. Yet, data in sPlotOpen should not be considered as representative of the distribution of plant communities worldwide, especially when working at local spatial extents. This should be kept in mind for applications such as species distribution models (SDMs) or joint SDMs, whose results might be affected by the uneven geographical distribution of sPlotOpen’s data. We refer the reader to the section ‘Usage notes’ for additional guidance on critical issues related, for instance, to incompletely sampled vegetation plots, varying plot size, and nested vegetation plots.
We started from the sPlot database v2.1 (created in October 2016), which contains 1,121,244 unique vegetation plots and 23,586,216 species records. Most of the data in sPlot refers to natural and semi-natural vegetation, while vegetation shaped by intensive and repeated human interference, such as cropland or ruderal communities, is hardly represented. Data originate from 110 different vegetation‐plot datasets of regional, national or continental extent, some of which stemming from regional or continental initiatives (see 23 for more information). For instance: 48 vegetation-plot datasets derive from the European Vegetation Archive (EVA) (17); three major African datasets derive from the Tropical African Vegetation Archive (TAVA); and multiple vegetation datasets in the USA and Australia derive from the VegBank (34; 35) and TERN’s AEKOS (36) archives, respectively. Data from other continents (South America, Asia) or countries were contributed as separate standalone datasets. The metadata of each individual vegetation-plot dataset stored in sPlot are managed through the Global Index of Vegetation‐Plot Databases GIVD (37), using the GIVD code as the unique dataset identifier.
Data in the sPlot database are unevenly distributed across vegetation types and geographic regions (see 25). Mid-latitude regions in developed countries (mostly Europe, the USA and Australia) are overrepresented in sPlot, while regions in the tropics and subtropics are underrepresented, which is a typical geographical bias in biodiversity data (e.g., 38; 4). To reduce this imbalance as much as possible, we performed a stratified resampling approach, using several environmental variables available at global extent as sampling strata.
First, we removed vegetation plots without geographical coordinates or with a location uncertainty higher than 3 km. We also removed vegetation plots identified by the respective data contributors as having been recorded in wetlands or in anthropogenic vegetation types, since these data were available only for few geographic regions, mostly in Europe. This resulted in a total of 799,400 out of the initial set of 1,121,244 vegetation plots.
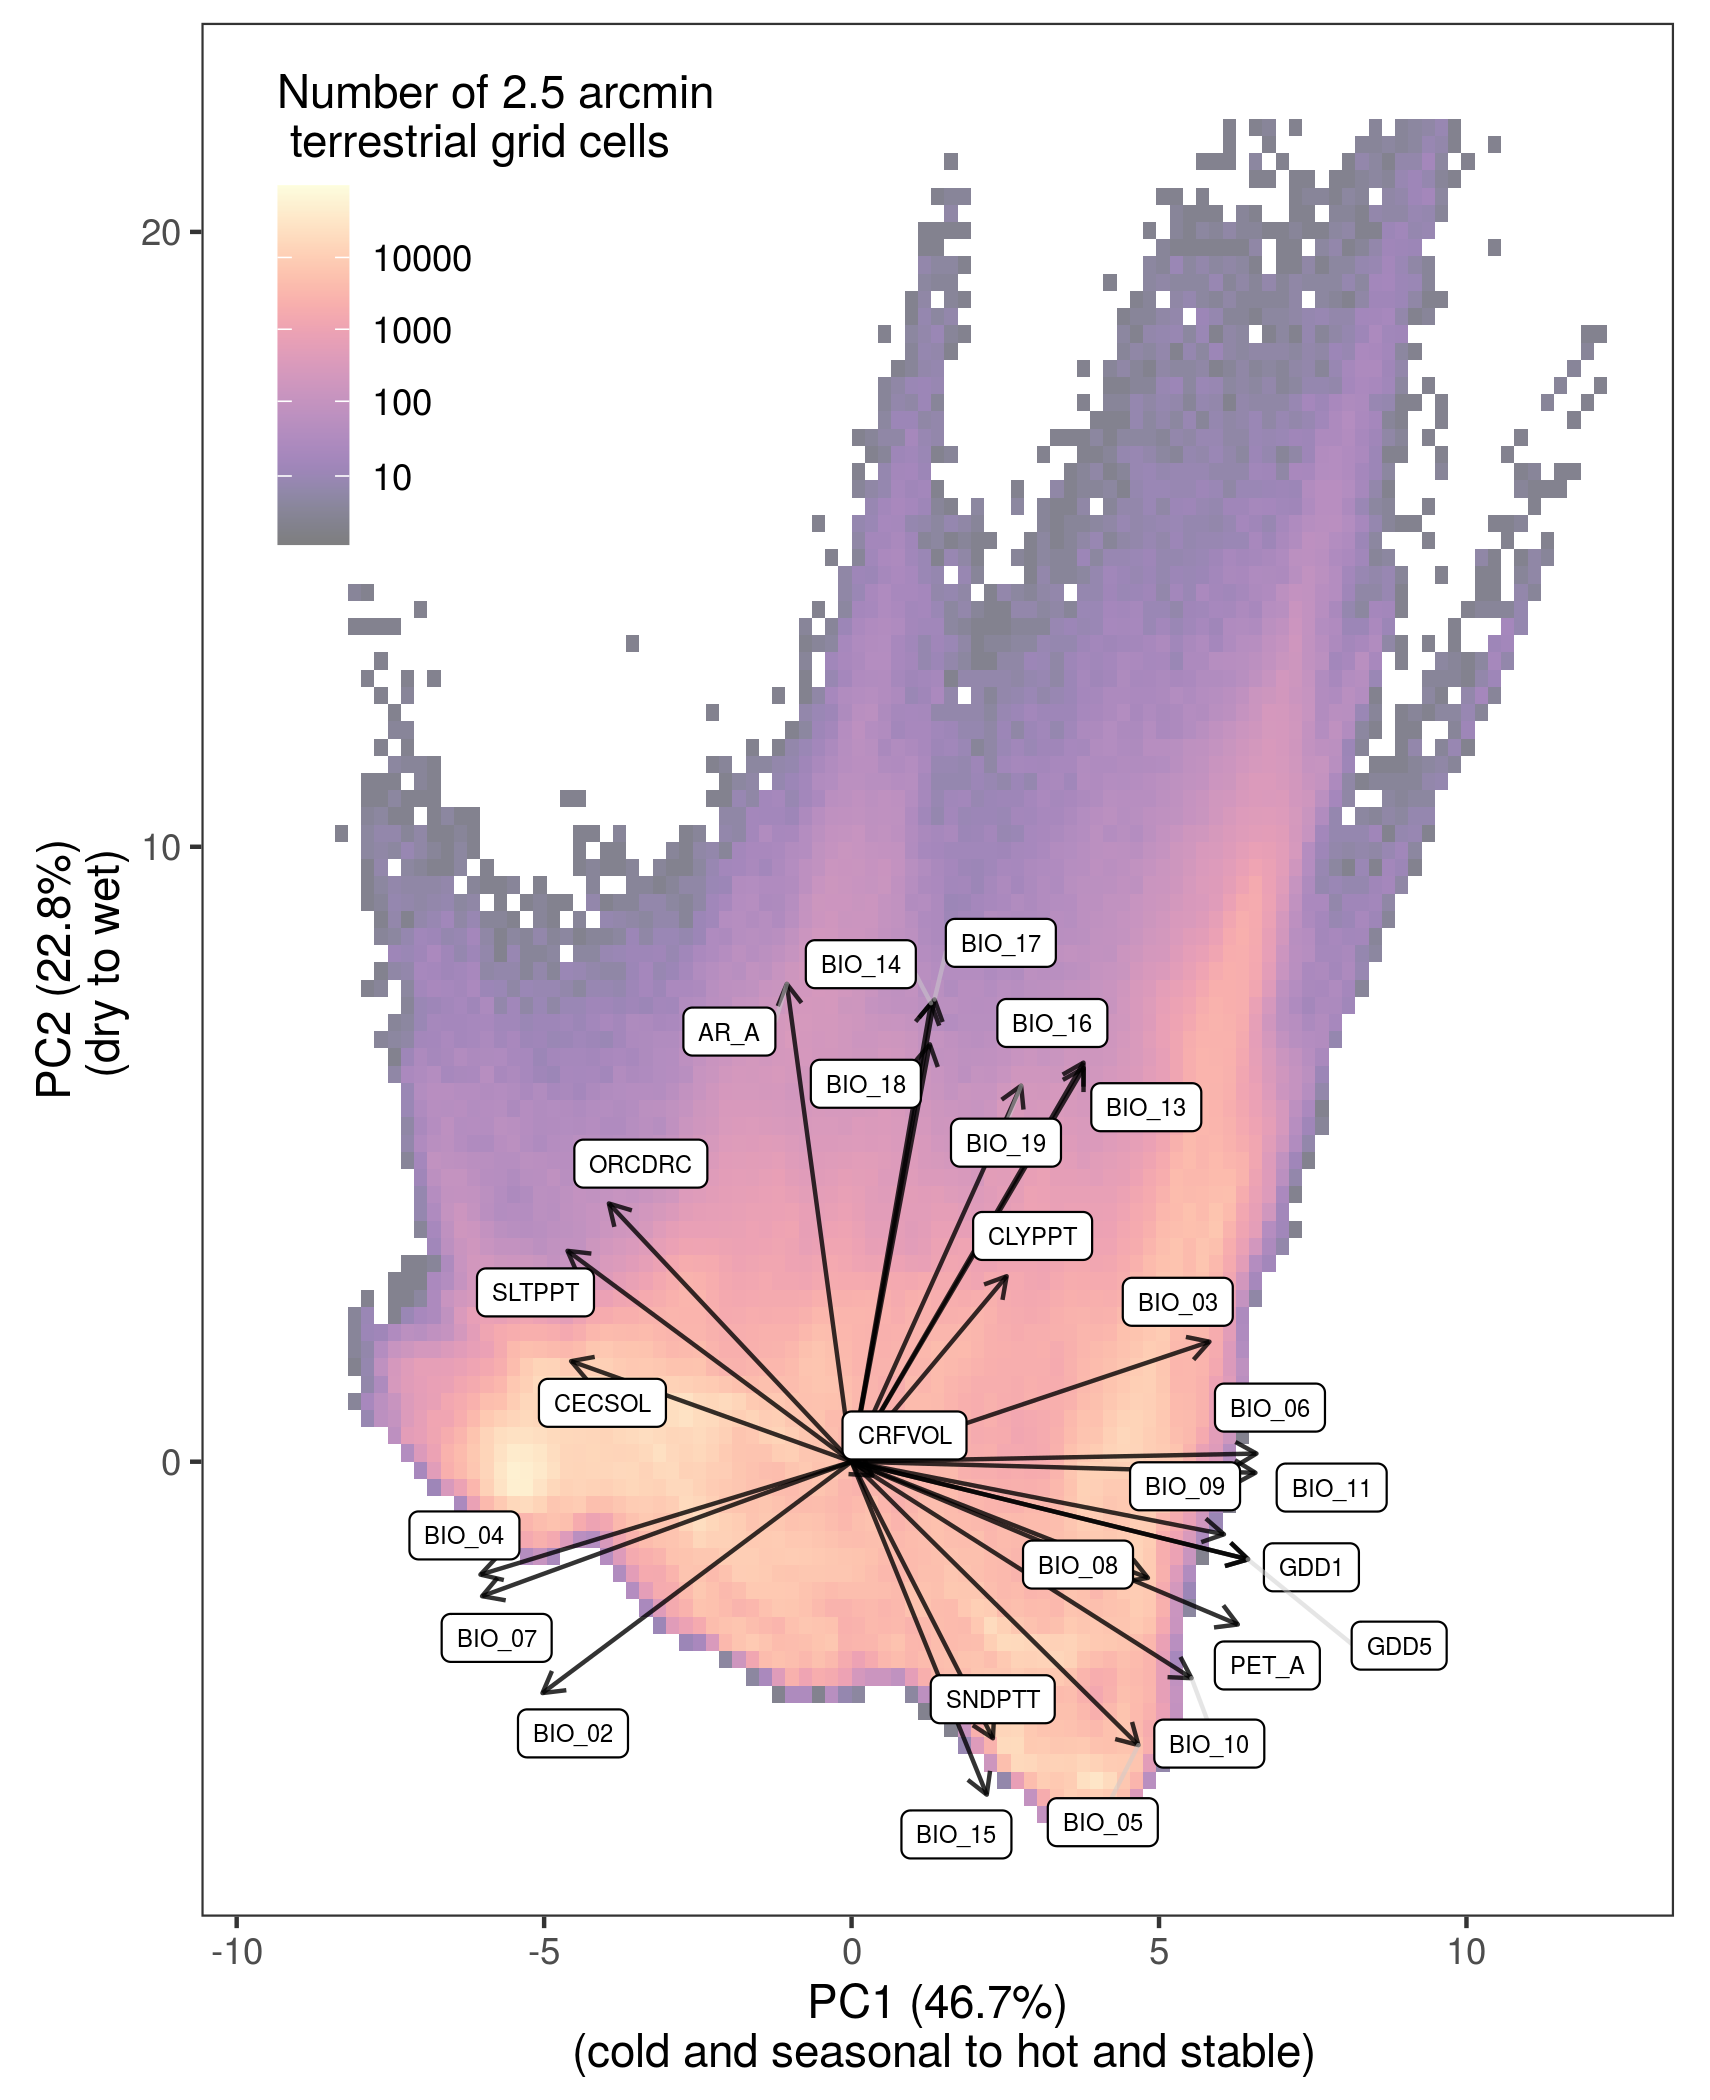
We then ran a global principal component analysis (PCA) on a matrix of all terrestrial grid cells at a spatial resolution of 2.5 arcmin (n = 8,384,404), based on 30 climatic and soil variables.
For climate, we used the 19 bioclimatic variables from CHELSA v1.2 (39), as well as two other bioclimatic variables reflecting the growing-season length (growing degree days above 1 °C - GDD1 - and 5 °C - GDD5), which were derived from CHELSA’s monthly average temperatures.
Specifically, we summed the number of days of those months with average temperature greater than 1 °C or 5 °C, respectively.
In addition, we considered an index of aridity and a layer for potential evapotranspiration from the Consortium of Spatial Information (CGIAR-CSI 40).
For soil, we extracted seven variables from the SoilGrids database (41), namely: (1) soil organic carbon content in the fine earth fraction; (2) cation exchange capacity; (3) pH; as well as the fractions of (4) coarse fragments; (5) sand; (6) silt; and (7) clay.
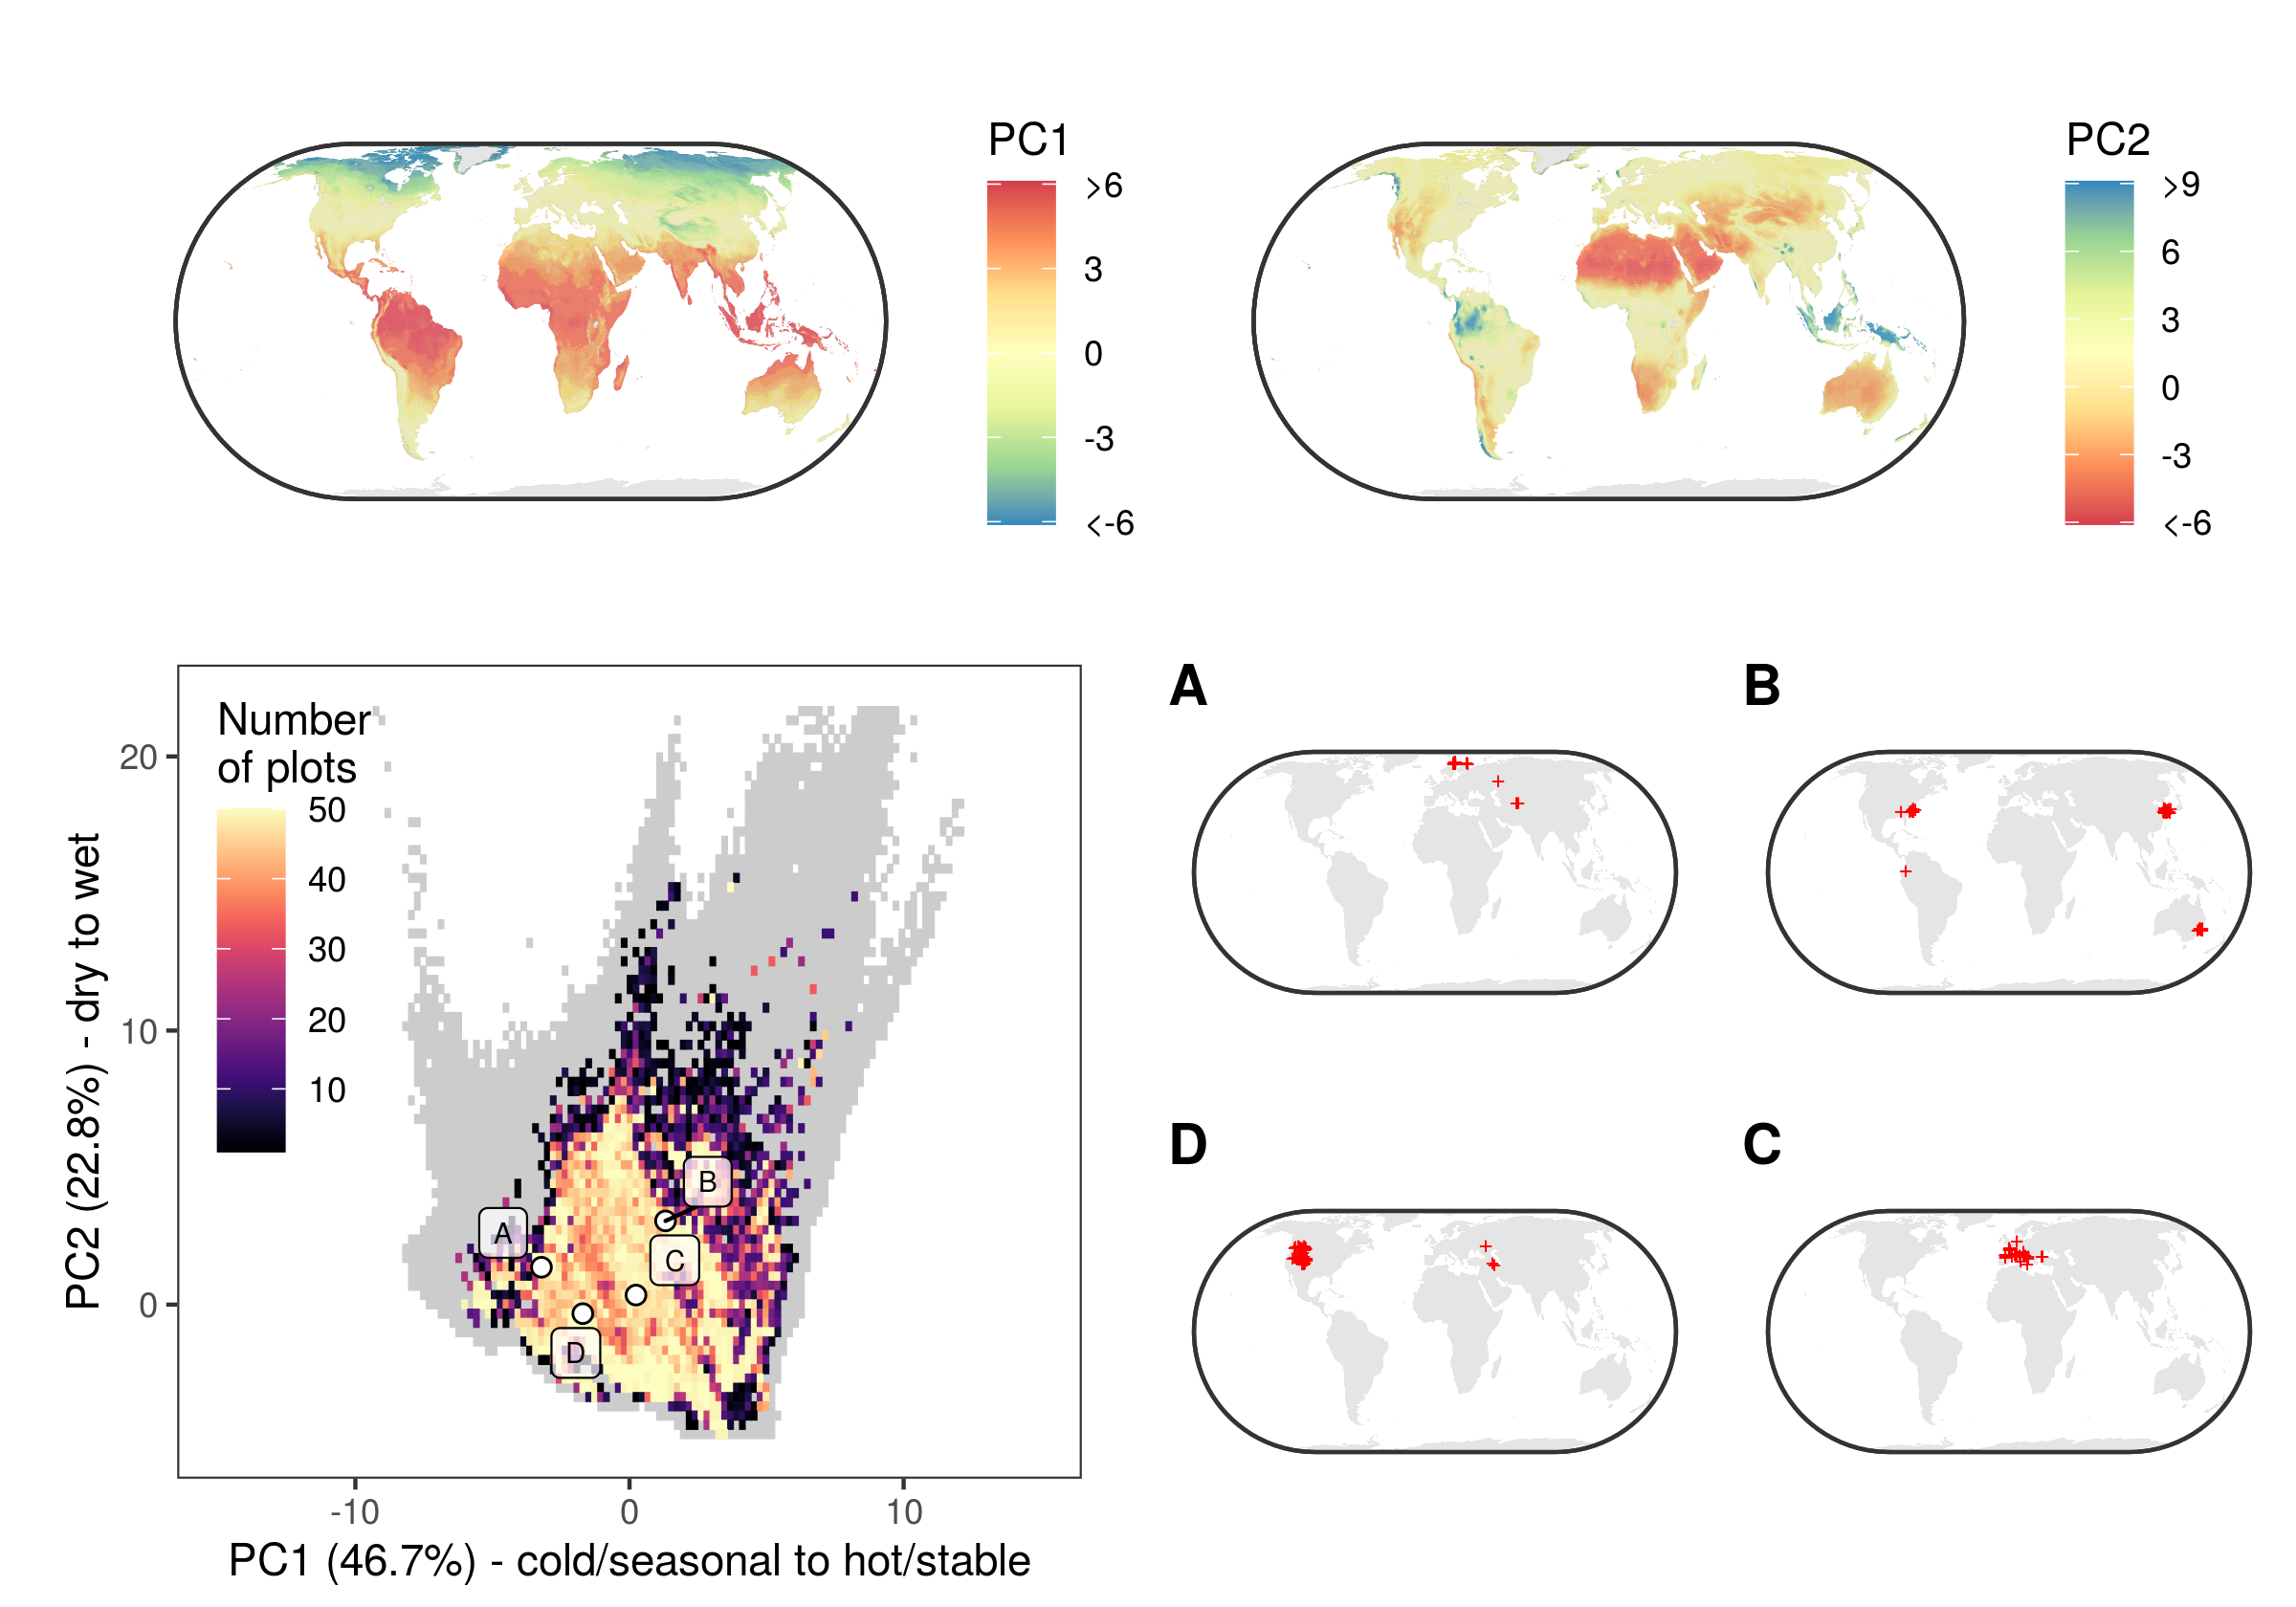
The results of this PCA represents the full environmental space of all terrestrial habitats on Earth, irrespective of whether a grid cell hosted vegetation plots or not (Figure S1).
We then subdivided the PCA ordination space, represented by the first two principal components (PC1–PC2), which accounted for 47% and 23% of the total environmental variation in terrestrial grid cells, into a regular 100 × 100 grid.
This PC1-PC2 two-dimensional space was subsequently used to balance our sampling effort across all PC1-PC2 grid cells for which vegetation plots were available.
After excluding 42,878 vegetation plots for which no PC1 or PC2 values were available, due to missing data in the bioclimatic or soil variables, we projected the remaining
756,522 vegetation plots onto this PC1-PC2 grid.
We finally calculated how many vegetation plots occurred in each PC1-PC2 grid cell (Figure 2).
In total, vegetation plots were available for 1,720 out of the 4,125 PC1-PC2 grid cells covered by the 8,384,404 terrestrial grid cells of the geographical space. We then resampled those PC1-PC2 grid cells (n = 858) with more than 50 vegetation plots, which is the median number of plots occurring across occupied grid cells in sPlot. This threshold of 50 vegetation plots represents a compromise between selecting a high number of plots, and keeping the resampled dataset as much balanced as possible across the PC1-PC2 environmental space. To select these 50 vegetation plots we used the heterogeneity-constrained random resampling algorithm from Lengyel et al. (2011) [42]. This approach optimizes the selection of a subset of vegetation plots that encompasses the highest variability in species composition while avoiding peculiar and rare communities, which may represent outliers. As such, our approach maximizes variability over representativeness when resampling vegetation plots. We quantified the variability in plant species composition among the 50 randomly selected vegetation plots by computing the mean and the variance of the Jaccard’s dissimilarity index (43) between all possible pairs of these 50 vegetation plots (n = 1,225). More precisely, for a given PC1-PC2 grid cell containing more than 50 vegetation plots, we generated 1,000 random selections of 50 vegetation plots and ranked each selection according to the mean (ascending order) and variance (descending order) value of the Jaccard’s dissimilarity index. Ranks from both sortings were summed for each random selection, and the selection with the lowest summed rank was considered to provide the most balanced/even representation of vegetation types within the focal grid cell. Where a grid cell contained less than 50 plots, we retained all of them. In this way, we reduced the imbalance towards over-sampled climate types while ensuring that the resampled dataset represents the entire environmental gradient covered by the original sPlot database. We repeated the whole resampling procedure three times to get three different environmentally-balanced, resampled subsets of our vegetation plots. These three resampling iterations can therefore be used as separate replicates, albeit these are not completely independent, as the same plots might have been drawn in different iterations. In addition, those plots located in PC1-PC2 grid cells with less than 50 vegetation plots are completely shared by all three iterations.
The resampling procedure resulted in 56,486, 56,501 and 56,494 vegetation plots selected during resampling iteration #1, #2 and #3, respectively, for a total 107,238 unique vegetation plots. Since the sPlot database is a consortium of independent datasets whose copyright belongs to the data contributor, we used this preliminary potential selection to ask each dataset’s custodian (i.e., either the owner of a dataset or its authorized representative in case of a collective dataset) for permission to release the data of selected vegetation plots as open access. For 12,134 unique vegetation plots, permission could not be granted because, for instance, the data are unpublished, confidential or sensitive. The number of vegetation plots for which the open-access permission was not granted in resampling iteration #1, #2 and #3 were 6,699, 6,690 and 6,705, respectively.
To mitigate the imbalance due to the exclusion of these confidential plots, we created a ‘consensus’ dataset. We started from resampling iteration #1, and replaced the 6,699 plots not granted as open access, with plots selected in the second and third iteration, for which such permission could be granted (‘reserve’ plots, hereafter). We imposed the constraint that each candidate vegetation plot in the reserve pool should belong to the same environmental stratum, i.e., the same PC1-PC2 grid cell, of the confidential vegetation plot, even if we acknowledge that this procedure does not maximize the variability in plant species composition of the replacement plots. Even after drawing from reserves, there were 3,150 plots that could not be replaced. These were distributed across 279 PC1-PC2 grid cells (16.2% of occupied cells), each cell having on average 11 irreplaceable plots (min = 1, median = 5, max = 50).
For each vegetation plot for which open access could be granted, we computed the community-weighted mean and variance for eighteen plant functional traits derived from the TRY database v3.0 (29). These traits were selected among those that describe the leaf, wood and seed economics spectra (44; 45), and are known to either affect different key ecosystem processes or respond to macroclimatic drivers, or both (23). The eighteen plant functional traits (all concentrations based on dry weight) were: (1) leaf area [mm2]; (2) stem specific density [g cm-3]; (3) specific leaf area [m2kg-1]; (4) leaf carbon concentration [mg g-1]; (5) leaf nitrogen concentration [mg g-1]; (6) leaf phosphorus concentration [mg g-1]; (7) plant height [m]; (8) seed mass [mg]; (9) seed length [mm]; (10) leaf dry matter content [g g-1]; (11) leaf nitrogen per area [g m-2]; (12) leaf N:P ratio [g g-1]; (13) leaf 𝛿15N [per million]; (14) seed number per reproductive unit; (15) leaf fresh mass [g]; (16) stem conduit density [mm-2]; (17) dispersal unit length [mm]; and (18) conduit element length [μm].
Because missing values were particularly widespread in the species-trait matrix, we calculated community-weighted means using the gap-filled version of these traits we received from TRY (29). Gap-filling was performed at the level of individual observations and relies on a hierarchical Bayesian modeling (R package ‘BHPMF’, 46; 47). This is a Bayesian machine learning approach, with no a priori assumptions, except for the data being missing completely at random. The algorithm “learns” from the data, i.e. if there was a phylogenetic signal in the data, this was used to fill the gaps but where no such signal was apparent, none was introduced. After gap-filling, we transformed to the natural logarithm all gap‐filled trait values and averaged each trait by taxon (i.e., at species, or genus level). The gap-filling approach was run only for species having at least one trait observation (n = 21,854). Additional information on the gap-filling procedure is available in [23].
Community‐weighted means (CWM) and variances (CWV) were calculated for every plant functional trait j and every vegetation plot k as follows (48):
\[ CWM_{j,k} = \sum_{i}^{n_k} p_{i,k} t_{i,j}\](1)
\[ CWV_{j,k} = \sum_{i}^{n_k} p_{i,k} (t_{i,j} - CWM_{j,k})^2\](2)
where nk is the number of species with trait information in vegetation plot k, pi,k is the relative abundance of species i in vegetation plot k calculated as the species’ fraction in cover or abundance of total cover or abundance, and ti,j is the mean value of species i for trait j.
sPlotOpen contains 95,104 unique vegetation plots from 105 constitutive datasets (Table 1) and from 114 countries covering all continents except Antarctica (Figure 1). This is the result of pooling together the three environmentally-balanced datasets from resampling iterations #1, #2 and #3 containing 49,787, 49,811 and 49,789 plots, respectively, after excluding the set of plots not granted as open access by data contributors. The number of plots shared across all three resampling iterations is 19,672, while 14,939 plots are shared between two iterations. Replacing confidential plots in resampling iteration #1 with reserves from the other two iterations in the same PC1-PC2 grid cell, resulted in a consensus version containing 53,262 plots. sPlotOpen only contains the species composition of vascular plants; information on the composition of bryophytes and lichens was discarded since it was only available for a minority of plots (n = 11,001 and n = 6,801, respectively). Information on the size (surface area) of the vegetation survey is available for 67,022 plots, and ranges between 0.03 and 40,000 m2 (mean = 377 m2; median = 100 m2). Specifically, sPlotOpen contains 12,894 plots with size smaller than 10 m2, 25,742 with size 10-100 m2, 24,750 plots with size 100-1,000 m2 and 3,075 plots with size greater or equal to 1,000 m2. Similarly, only for a minority of plots (n = 24,167) information on the exact group of plants sampled in the field is available (e.g., complete vegetation, only trees, only trees > 1 m height, and so on). However, as most data were collected using the phytosociological method, we deem safe to assume that, unless otherwise specified, plots contain information on all vascular plants. We retained plots with incomplete vegetation, because they were mostly located in the tropics, i.e., in areas where vegetation plots are particularly scarce otherwise. The average number of vascular plant species per vegetation plot ranges between 1 (i.e. monospecific stands) and 271 species (mean = 20; median = 16).
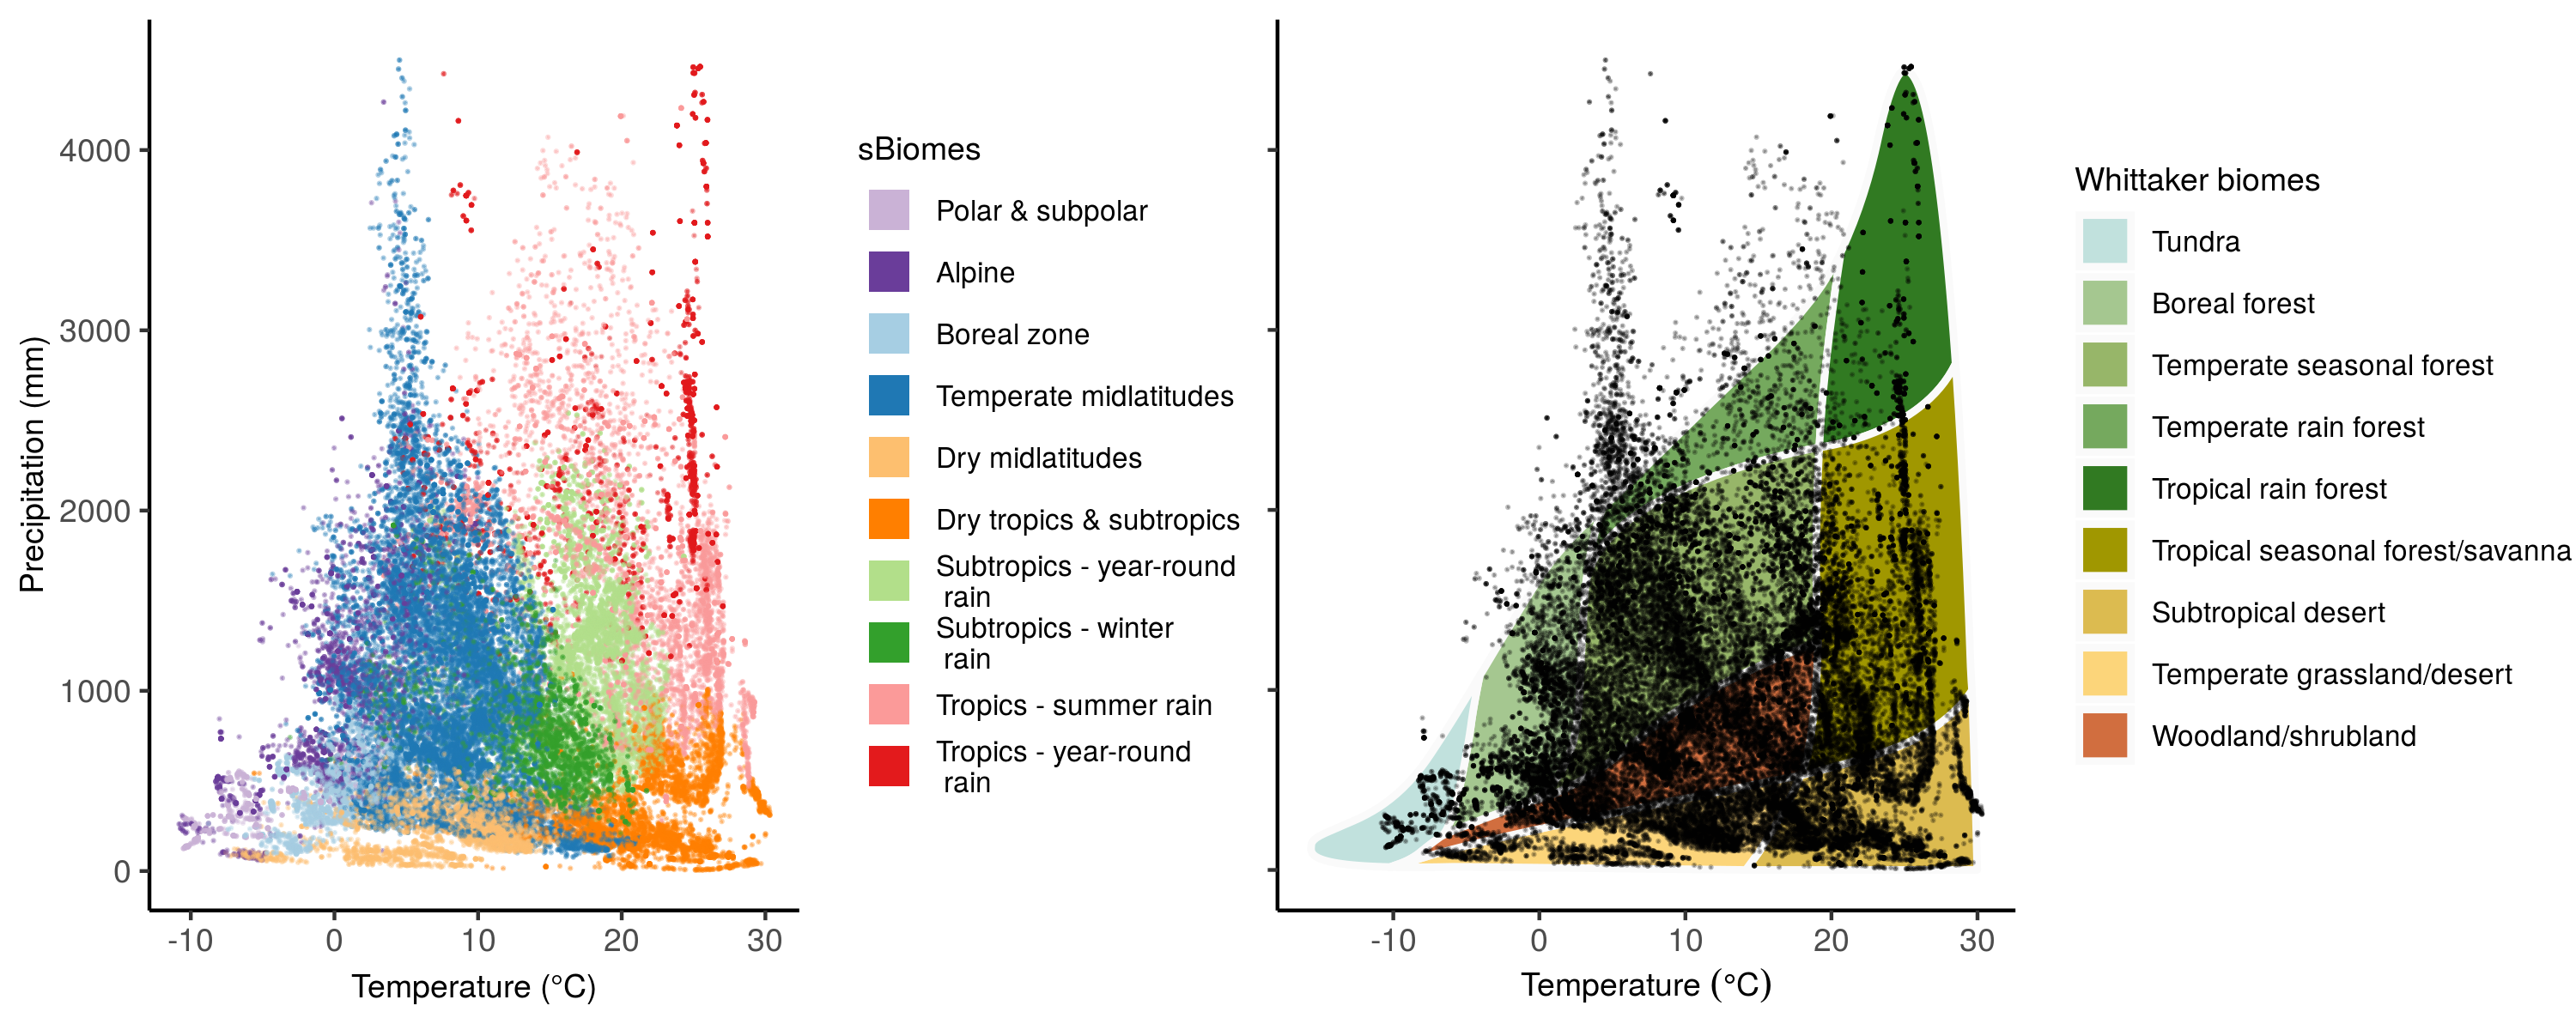
By capping the number of vegetation plots in overrepresented environmental conditions, the resampling procedure described above strongly reduced the bias in the distribution of vegetation plots within the PC1-PC2 environmental space. Yet, due to the lack or scarcity of data from some geographical regions, like the tropics, there is some remaining imbalance in the spatial distribution of vegetation plots across geographical regions (Figure 1). This is evident when comparing the number of plots across continents or biomes. When considering the first resampling iteration only (n = 49,787), Europe is by far the best represented continent, with 15,920 vegetation plots. The least represented continents are Africa and South America, with 3,709 and 5,498 vegetation plots, respectively. Some residual imbalance remains also when considering biomes. With the exception of the ‘Temperate mid-latitudes’ biome, which includes 14,100 vegetation plots, all other biomes have a number of plots comprised between 1,558 (‘Polar and subpolar zone’) and 6,245 (‘Subtropics with year-round rain’) vegetation plots (Figure 3, left). Despite this residual imbalance, all the Whittaker biomes are covered by sPlotOpen (Figure 3, right), and our resampling algorithm has resulted in a much more balanced dataset than many other global datasets that are available, such as GBIF.
Almost one third of the 95,104 vegetation plots in sPlotOpen belong to forests (n = 38,282), one half to non-forest vegetation (n = 45,735), with 11.6 % of plots remaining unassigned (n = 11,087). When not directly done by data providers, the assignment of plots to forests and non-forests was based on multiple lines of evidence, including the plot-level information on the cover of the tree layer, as well as traits of species composing a plot, such as growth form and height. In short, a plot record was considered as forest if the cover of the tree layer, or alternatively, the sum of the (relative) cover of all tree taxa (scaled by the sum of all cover values, in percentage), was greater than 25%. It was considered a non-forest record if the sum of relative cover of low‐stature, non‐tree and non‐shrub taxa was greater than 90%. For an extensive explanation of this classification scheme, we refer the reader to Bruelheide et al. (2019) [23]. Even if the proportion of forest vs. non-forest vegetation plots is relatively well-balanced, the geographical distribution of vegetation plots belonging to different vegetation types is likely not balanced in the geographical space, as it depends on the idiosyncrasies of the constitutive datasets composing the sPlot database. For instance, the data from New Zealand only include plots collected in non-forest ecosystems, while data from Chile only refer to forests. We urge potential users to carefully read the description of each individual dataset in GIVD and to contact the custodians of each dataset for further information.
sPlotOpen is organized into three main matrices, relationally linked through the key column ‘PlotObservationID’.
The ‘header’ matrix contains plot-level information for the 95,104 vegetation plots, including: metadata (e.g., plot ID, ownership, sampling date, geographical location, positional accuracy); sampling design information (e.g., the total surface area used during the vegetation survey); and a plot-level description of vegetation structure (e.g., vegetation type, percentage cover of each vegetation layer), vegetation type, and naturalness level (i.e., whether a plot belongs to the same formation that would occupy the site without human interference). Plots in Europe are also classified according to the EUNIS habitat classification (column ‘ESY’), based on the habitat classification expert system described in Chytrý et al. (2020) [53]. For each vegetation plot, we further provide information on the dataset it originates from, based on the IDs used in GIVD. We also report four binary fields describing whether a plot belongs to the three resampling iterations (columns ‘Resample_1’, ‘Resample_2’, ‘Resample_3’), or to the first resampling iteration after the inclusion of replacement plots (column ‘Resample_1_consensus’). A brief summary of all the 47 variables in the header matrix is provided in Table 2.
The ‘DT’ matrix contains data on the species composition of each plot. It is structured in a long format and contains 1,945,384 records from 42,680 vascular plant taxa, mostly resolved at the species level. For each record, we report both the taxon name as originally contributed by the data custodian (column ‘Original_species’), and the taxon name after taxonomic standardization (column ‘Species’). For details on the taxonomic standardization, please see ‘Technical Validation’ below. For each species we also provided cover/abundance values. These follow different standards across the datasets constituting the sPlot database. We, therefore, provide both the cover/abundance value as reported in the original data (column ‘Original_abundance’), together with the abundance scale that was originally used (column ‘Abundance_scale’). This can take seven values: ‘CoverPerc’ = percentage cover; ‘pa’ = presence-absence; ‘x_BA’ = basal area (m2/ha, only for woody species); ‘x_IC’ = individual count, i.e., number of individuals in plot; ‘x_SC’ = stem count, i.e., number of stems in plot; ‘x_IV’ = importance value index; ‘x_PF’ = presence frequency. The great majority of entries, however, use the percentage cover scale (n= 1,709,000). Finally, for each entry, we calculated a ‘Relative_cover’, i.e., the cover/abundance of a given taxon divided by the total cover/abundance of all taxa in that vegetation plot.
The ‘CWM_CWV’ matrix contains the community-weighted means and variances calculated for each of the 18 functional traits mentioned above. It also contains three additional columns. The column ‘Species_richness’ shows the number of species recorded in each plot. The columns ‘Trait_coverage_cover’ and ‘Trait_coverage_pa’ provide, respectively, the proportion of total cover and the proportion of species in a plot for which functional trait information was available. In total, functional trait information was available for 21,854 species. As functional trait information was based on gap-filled data (see above), each of these 21,854 species had information for all the 18 functional traits. The average proportion of species in each plot for which functional trait information was available is 0.85 (median = 0.95). For 42,012 plots, the coverage was complete, while we do not have functional trait information for any of the species occurring in 482 plots. When considering relative cover, the average trait coverage is 0.87, with 74,151 plots having functional trait information for species cumulatively accounting for more than 80% of relative cover. When considering the number of species, 68,041 plots have functional trait information for 80% or more of the species occurring in that plot.
sPlotOpen contains two additional objects. The ‘metadata’ matrix contains plot-level metadata, which provide information on the origin of each individual vegetation plot. This object contains 15 columns, with information on the dataset of origin (column ‘GIVD_ID’ - 37), author or surveyor names (columns ‘Releve_author’ and ‘Releve_coauthor’), bibliographic references both at the dataset (column ‘DB_BIBTEXKEY’) and plot level (‘Plot_Biblioreference’ and ‘BIBTEXKEY’), when available. Similarly, the column ‘Project_name’ provides information on the project in which a vegetation plot was collected. When available, we also provide information on the numbering of the plots in the publication where they originally appeared (columns ‘Nr_table_in_publ’, ‘Nr_releve_in_table’), or in the dataset where they were initially stored (‘Original_nr_in_database’). In the case of nested plots (n = 1,851), we also provide the original plot and subplot IDs (columns: ‘Original_plotID’, ‘Original_subplotID’). The last two columns report plot-level ‘Remarks’, and the unique identifier produced by Turboveg when the vegetation plot was first stored (‘GUID’).
Finally, the object ‘references’, contains all the bibliographic references formatted according to a BibTex standard. Each reference is tagged with a key corresponding to the fields ‘DB_BIBTEXKEY’ and ‘BIBTEXKEY’ in the metadata. We further provide an R function (‘sPlotOpen_citation’) to create reference lists, based on a selection of plots and/or datasets.
Except for the ‘reference’ file (format .bib), all objects/matrices are provided in tab-delimited .txt files. All objects, including the ‘sPlotOpen_citation’ function, are also compiled inside an .RData object.
The original sPlot database has a nested structure and consists of several individual datasets, each validated and maintained by its respective dataset custodian. In many cases, individual datasets are also collections whose vegetation plots were provided by their respective owners (the person who performed the actual vegetation survey) or by someone who digitized the original data from the scientific published or grey literature. We obviously have no direct control over the individual vegetation plots that we provide here in sPlotOpen. Yet, all these vegetation plots stem from trained professional botanists, or published scientific work, and are accompanied by detailed information on the sampling protocols used, thus ensuring data quality and reliability.
Before integration into the sPlot database, each dataset was further checked for consistency. If the dataset was in a different format, we converted it to a Turboveg 2 dataset (54). Turboveg is a program specifically designed for the storage, selection and export of vegetation plots (https://www.synbiosys.alterra.nl/turboveg/). During this conversion, we checked that all datasets contained the required metadata information, and cross-checked that each plot was located within the geographic scopes of its respective dataset. All individual Turboveg 2 datasets were then integrated into a Turboveg 3 database, and exported to comma-separated files. Finally, we harmonized all the taxonomic names from all datasets, based on the sPlot’s taxonomic backbone (55). This backbone matched all the taxonomic names (without nomenclatural authors) from all datasets in sPlot 2.1 and TRY v3.0 (29) to their resolved version based on the Taxonomic Name Resolution Service web application (TNRS version 4.0; 56). This allowed us to (1) harmonize all datasets to a common nomenclature, and (2) link the sPlot database to the TRY database (29). The final backbone only retained matched taxonomic names at the rank of species or higher. Additional detail on the taxonomic resolution is reported in [23], while a description of the workflow, including R‐code, is available in [55].
The sPlotOpen database can be downloaded from https://doi.org/10.25829/idiv.3474-40-3292. Users are urged to cite the original sources when using sPlotOpen in addition to the present paper, particularly when using data contained in BioTIME (57). For two datasets (AF-00-009, AF-CD-001), the identification of taxa at species level is still in progress. Data on lichens and mosses, where available (e.g., dataset NA-GL-001), can be obtained on request from the respective dataset custodian or sPlot coordinator. As most of the constitutive datasets remain under continuous development, sPlotOpen users are encouraged to get in touch with the custodian(s) of the data they are planning to use (custodian names are reported in https://www.idiv.de/en/splot).
The use of sPlotOpen comes with a number of warnings. First, sPlotOpen was resampled in a way that maximizes the compositional variability of vegetation in different environmental conditions. As such, sPlotOpen should not be considered as representative of the distribution of plant communities worldwide. Second, for most regions data was collected opportunistically, and without a randomized sampling design. This might lead to some vegetation types being oversampled in some regions, but undersampled in other regions, which might affect the output of species distribution models, especially at local or regional spatial extents. Third, not all plots were sampled using the same plot size, which should be accounted for when comparing biodiversity indices (e.g., species richness, beta-diversity) across plots or regions. Fourth, not all plots contain complete information on all plant species. A limited number of plots, mostly located in tropical regions, only contain data on woody species. This should be kept in mind when exploring biodiversity patterns. Finally, a small fraction of plots represent nested subsets of larger plots. Depending on the application, this might or might not represent a problem. Nested plots can be identified using the information in the ‘metadata’ matrix. The most appropriate way to deal with these problems depends on the problem being analyzed. Users are therefore invited to carefully consider the limitations above when designing applications relying on sPlotOpen.
The data included in the present paper represent the subset of sPlot for which we were able to secure permission for making these data open. The additional data in sPlot are available under sPlot’s Governance and Data Property Rules (https://www.idiv.de/en/splot). Using the full sPlot dataset is also recommended if a stratification is desired that is different from the environmental factors used here, for example by geographical region or plot size.
The R code used to produce sPlotOpen from the sPlot 2.1 database is contained in the sPlotOpen_code GitHub repository: https://github.com/fmsabatini/sPlotOpen_Code. A short interactive vignette introducing to the use of sPlotOpen is in Appendix 1. This manuscript was produced using the Manubot workflow (58). The code for reproducing this manuscript is stored in the sPlotOpen_manuscript GitHub repository: https://github.com/fmsabatini/sPlotOpen_Manuscript.
We are grateful to thousands of vegetation scientists who sampled vegetation plots in the field or digitized them into regional, national or international databases. We also appreciate the support of the German Research Foundation for funding sPlot as one of the iDiv (DFG FZT 118, 202548816) research platforms, as well as for funding the position of Francesco Maria Sabatini and the organization of three workshops through the sDiv calls. We acknowledge this support with naming the database “sPlot”, where the “s” refers to the sDiv synthesis workshops. We are also grateful to Anahita Kazem and iDiv’s Data & Code Unit for assistance with curation and archiving of the dataset.
The study has been supported by the TRY initiative on plant traits (http://www.try-db.org). The TRY initiative and database is hosted, developed and maintained by J. Kattge and G. Bönisch (Max Planck Institute for Biogeochemistry, Jena, Germany). TRY is currently supported by DIVERSITAS/Future Earth and the German Centre for Integrative Biodiversity Research (iDiv) Halle-Jena-Leipzig. Jens Kattge acknowledges support by the Max Planck Institute for Biogeochemistry (Jena, Germany), Future Earth, the German Centre for Integrative Biodiversity Research (iDiv) Halle-Jena-Leipzig and the EU H2020 project BACI, Grant No 640176.
Isabelle Aubin was funded through Natural Sciences and Engineering Research Council of Canada and Ontario Ministry of Natural Resources and Forestry. Yves Bergeron was funded through Natural Sciences and Engineering Research Council of Canada. Idoia Biurrun was funded by the Basque Government (IT936-16). Anne Bjorkman thanks the Herschel Island-Qikiqtaruk Territorial Park management, Catherine Kennedy, Dorothy Cooley, Jill F. Johnstone, Cameron Eckert and Richard Gordon for establishing the ecological monitoring programme. Funding was provided by Herschel Island-Qikiqtaruk Territorial Park. Luis Cayuela was supported by project BIOCON08_044 funded by Fundación BBVA. Milan Chytrý, Flavia Landucci, Corrado Marcenò and Tomáš Peterka were supported by the Czech Science Foundation (project no. 19-28491X). Brian Enquist thanks the following individuals and institutions for contributing data to sPlot via the SALVIAS database: Mauricio Bonifacino, Saara DeWalt, Timothy Killeen, Susan Letcher, Nigel Pitman, Cam Webb, The Missouri Botanical Garden, RAINFOR and the Amazon Forest Inventory Network. Alvaro G. Gutiérrez was funded by Project FORECOFUN-SSA PIEF-GA-2010–274798 and FONDECYT 1200468. Mohamed Z. Hatim thanks Kamal Shaltout and Joop Schaminée for supervision of the MSc thesis, and Joop Schaminée for support and funding from the Prince Bernard Culture Fund Prize for Nature Conservation. Jürgen Homeier received funding from BMBF (Federal Ministry of Education and Science of Germany) and the German Research Foundation (DFG Ho3296-2, DFG Ho3296-4). Borja Jiménez-Alfaro was funded by the Spanish Research Agency through grant AEI/10.13039/501100011033. Dirk N. Karger received funding from: The WSL internal grant exCHELSA and ClimEx, the Joint Biodiversa COFUND project ‘FeedBaCks’ and ‘Futureweb’, the Swiss Data Science Projects: SPEEDMIND, and COMECO, and the Swiss National Science Foundation (20BD21_184131). Larisa Khanina was supported by the Ministry of Science and Higher Education of the Russian Federation (project no. AAAA-A19-119012490096-2). Hjalmar Kühl gratefully acknowledges the Pan African team and funding by Max Planck Society and Krekeler Foundation. Attila Lengyel was supported by the National Research, Development and Innovation Office, Hungary (PD-123997). Tatiana Lysenko was funded by Russian Foundation for Basic Research (grant No. 16-04-00747a). Alireza Naqinezhad is supported by a master grant from the University of Mazandaran. Jérôme Munzinger was supported by the French National Research Agency (ANR) with grants INC (ANR-07-BDIV-0008), BIONEOCAL (ANR-07-BDIV-0006) & ULTRABIO (ANR-07-BDIV-0010), by National Geographic Society (Grant 7579-04), and with fundings and authorizations of North and South Provinces of New Caledonia. Arkadiusz Nowak received support from the National Science Centre, Poland, grant no. 2017/25/B/NZ8/00572. Gerhard E. Overbeck acknowledges support from Brazil’s National Council of Scientific and Technological Development (CNPq, grant 310022/2015-0). Meelis Pärtel was supported by the Estonian Research Council (PRG609) and European Regional Development Fund (Centre of Excellence EcolChange) Robert Peet acknowledges the support from the National Center for Ecological Analysis and Synthesis, the North Carolina Ecosystem Enhancement Program, the U.S. Forest Service, and the U.S. National Science Foundation (DBI-9905838, DBI-0213794). Josep Peñuelas acknowledges the financial support from the European Research Council Synergy grant ERC-SyG-2013-610028 IMBALANCE-P. Petr Petřík and Jiri Dolezal acknowledge the support of the long-term research development project No. RVO 67985939 of the Czech Academy of Sciences. Oliver Phillips was funded by an ERC Advanced Grant (291585, “T-FORCES”) and a Royal Society-Wolfson Research Merit Award. Valério D. Pillar has been supported by the Brazil’s National Council of Scientific and Technological Development (CNPq, grant 307689/2014-0). Solvita Rūsiņa was supported by the University of Latvia grant AAP2016/B041//Zd2016/AZ03 within the “Climate change and sustainable use of natural resources”. Franziska Schrodt was supported by the University of Minnesota Institute on the Environment Discovery Grant, the German Centre for Integrative Biodiversity Research (iDiv) Halle-Jena-Leipzig grant (50170649_#7) and the University of Nottingham Anne McLaren Fellowship. Jozef Šibík was funded by The Slovak Research and Development Agency grant nr. APVV16-0431. Jens Christian Svenning considers this work a contribution to his VILLUM Investigator project “Biodiversity Dynamics in a Changing World” funded by VILLUM FONDEN (grant 16549). Kim André Vanselow would like to thank W. Bernhard Dickoré for the help in the identification of plant species and acknowledges the financial support from the Volkswagen Foundation (AZ I/81 976) and the German Research Foundation (DFG VA 749/1-1, DFG VA 749/4-1). Evan Weiher was funded by NSF DEB-0415383, UWEC-ORSP, and UWEC-BCDT. Work by Karsten Wesche was supported by the German Research Foundation (DFG WE 2601/3-1,3-2, 4-1,4-2) and by the German Ministry for Science and Education (BMBF, CAME 03G0808A). Susan Wiser was funded by the NZ Ministry for Business, Innovation and Employment’s Strategic Science Investment Fund.
This paper is dedicated to the memory of Dr. Ching-Feng (Woody) Li.
FMS wrote the first draft of the manuscript, with considerable input from JL and HB. JL and TH wrote the resampling algorithm. FMS set up the GitHub projects, curated the database, and produced the graphs. He also coordinated the sPlot consortium. SMH wrote the Turboveg software, which holds the sPlot database. JK provided the trait data from TRY and FS performed the trait data gap filling. HB secured the funding for sPlot as a strategic project of iDiv. All other authors contributed data and/or helped set up the database and/or helped develop the resampling algorithm. All authors contributed to revising and approved the manuscript.
The authors declare no competing interests.
sPlot is a collaborative initiative to integrate existing local and national vegetation-plot datasets into a global harmonized database. It was initiated in 2013, within the sDiv working group “Plant trait-environment relationships across the world’s biomes”. Since then, it became established as the largest vegetation-plot databases worldwide and coordinates a consortium of 251 individual active members, representing 167 local and national datasets. sPlot’s overarching scientific goal is the exploration of all aspects of global plant community diversity, including taxonomic, functional and phylogenetic diversity, across biomes, vegetation types, taxonomic or functional guilds and scales. Central to sPlot’s mission are the exploration of the relationships between environmental drivers, trait variation, and assembly processes in local plant communities worldwide.
1. Summary for policymakers of the global assessment report on biodiversity and ecosystem services of the Intergovernmental Science-Policy Platform on Biodiversity and Ecosystem Services
IPBES
IPBES secretariat (2019)
ISBN: 978-3-947851-13-3
2. Living planet report
WWF
(2018)
ISBN: 9782940529902
3. Accelerating homogenization of the global plant–frugivore meta-network
Evan C. Fricke, Jens-Christian Svenning
Nature (2020-09-02) https://doi.org/ghgs3g
DOI: 10.1038/s41586-020-2640-y · PMID: 32879498
4. Species better track climate warming in the oceans than on land
Jonathan Lenoir, Romain Bertrand, Lise Comte, Luana Bourgeaud, Tarek Hattab, Jérôme Murienne, Gaël Grenouillet
Nature Ecology & Evolution (2020-05-25) https://doi.org/ggx3np
DOI: 10.1038/s41559-020-1198-2 · PMID: 32451428
5. Replacements of small- by large-ranged species scale up to diversity loss in Europe’s temperate forest biome
Ingmar R. Staude, Donald M. Waller, Markus Bernhardt-Römermann, Anne D. Bjorkman, Jörg Brunet, Pieter De Frenne, Radim Hédl, Ute Jandt, Jonathan Lenoir, František Máliš, … Lander Baeten
Nature Ecology & Evolution (2020-04-13) https://doi.org/ggrs73
DOI: 10.1038/s41559-020-1176-8 · PMID: 32284580
6. Biodiversity redistribution under climate change: Impacts on ecosystems and human well-being
Gretta T. Pecl, Miguel B. Araújo, Johann D. Bell, Julia Blanchard, Timothy C. Bonebrake, I-Ching Chen, Timothy D. Clark, Robert K. Colwell, Finn Danielsen, Birgitta Evengård, … Stephen E. Williams
Science (2017-03-31) https://doi.org/f9xmpm
DOI: 10.1126/science.aai9214 · PMID: 28360268
7. Managing consequences of climate‐driven species redistribution requires integration of ecology, conservation and social science
Timothy C. Bonebrake, Christopher J. Brown, Johann D. Bell, Julia L. Blanchard, Alienor Chauvenet, Curtis Champion, I‐Ching Chen, Timothy D. Clark, Robert K. Colwell, Finn Danielsen, … Gretta T. Pecl
Biological Reviews (2017-06) https://doi.org/gc2dvc
DOI: 10.1111/brv.12344 · PMID: 28568902
8. A Significant Upward Shift in Plant Species Optimum Elevation During the 20th Century
J. Lenoir, J. C. Gegout, P. A. Marquet, P. de Ruffray, H. Brisse
Science (2008-06-27) https://doi.org/bnhhj8
DOI: 10.1126/science.1156831 · PMID: 18583610
9. The functional role of producer diversity in ecosystems
Bradley J. Cardinale, Kristin L. Matulich, David U. Hooper, Jarrett E. Byrnes, Emmett Duffy, Lars Gamfeldt, Patricia Balvanera, Mary I. O’Connor, Andrew Gonzalez
American Journal of Botany (2011-03) https://doi.org/fnh8qs
DOI: 10.3732/ajb.1000364 · PMID: 21613148
10. The biomass distribution on Earth
Yinon M. Bar-On, Rob Phillips, Ron Milo
Proceedings of the National Academy of Sciences (2018-06-19) https://doi.org/cp29
DOI: 10.1073/pnas.1711842115 · PMID: 29784790 · PMCID: PMC6016768
11. Effective Biodiversity Monitoring Needs a Culture of Integration
Hjalmar S. Kühl, Diana E. Bowler, Lukas Bösch, Helge Bruelheide, Jens Dauber, David. Eichenberg, Nico Eisenhauer, Néstor Fernández, Carlos A. Guerra, Klaus Henle, … Aletta Bonn
One Earth (2020-10) https://doi.org/ghgk4w
DOI: 10.1016/j.oneear.2020.09.010
12. What we need to know to prevent a mass extinction of plant species
Stuart L. Pimm
PLANTS, PEOPLE, PLANET (2020-10-28) https://doi.org/ghhwnp
DOI: 10.1002/ppp3.10160
13. Cyberinfrastructure for an integrated botanical information network to investigate the ecological impacts of global climate change on plant biodiversity
Brian J Enquist, Rick Condit, Robert K Peet, Mark Schildhauer, Barbara M. Thiers
PeerJ (2018-01-13) https://doi.org/ghfnsx
DOI: 10.7287/peerj.preprints.2615v2
14. GIFT – A Global Inventory of Floras and Traits for macroecology and biogeography
Patrick Weigelt, Christian König, Holger Kreft
Journal of Biogeography (2019-06-09) https://doi.org/gf38t6
DOI: 10.1111/jbi.13623
15. Distorted Views of Biodiversity: Spatial and Temporal Bias in Species Occurrence Data
Elizabeth H. Boakes, Philip J. K. McGowan, Richard A. Fuller, Ding Chang-qing, Natalie E. Clark, Kim O’Connor, Georgina M. Mace
PLoS Biology (2010-06-01) https://doi.org/brfdq6
DOI: 10.1371/journal.pbio.1000385 · PMID: 20532234 · PMCID: PMC2879389
16. Versuch einer Übersicht über die Wiesentypen der Schweiz
F. G. Stebler, C. Schröter
Landwirt. Jahrb. Schweiz (1893)
17. European Vegetation Archive (EVA): an integrated database of European vegetation plots
Milan Chytrý, Stephan M. Hennekens, Borja Jiménez-Alfaro, Ilona Knollová, Jürgen Dengler, Florian Jansen, Flavia Landucci, Joop H. J. Schaminée, Svetlana Aćić, Emiliano Agrillo, … Sergey Yamalov
Applied Vegetation Science (2016-01) https://doi.org/bc7k
DOI: 10.1111/avsc.12191
18. Sample selection bias and presence-only distribution models: implications for background and pseudo-absence data
Steven J. Phillips, Miroslav Dudík, Jane Elith, Catherine H. Graham, Anthony Lehmann, John Leathwick, Simon Ferrier
Ecological Applications (2009-01) https://doi.org/dx4s78
DOI: 10.1890/07-2153.1 · PMID: 19323182
19. Global environmental change effects on plant community composition trajectories depend upon management legacies
Michael P. Perring, Markus Bernhardt-Römermann, Lander Baeten, Gabriele Midolo, Haben Blondeel, Leen Depauw, Dries Landuyt, Sybryn L. Maes, Emiel De Lombaerde, Maria Mercedes Carón, … Kris Verheyen
Global Change Biology (2018-04) https://doi.org/gc6mjp
DOI: 10.1111/gcb.14030 · PMID: 29271579
20. Accelerated increase in plant species richness on mountain summits is linked to warming
Manuel J. Steinbauer, John-Arvid Grytnes, Gerald Jurasinski, Aino Kulonen, Jonathan Lenoir, Harald Pauli, Christian Rixen, Manuela Winkler, Manfred Bardy-Durchhalter, Elena Barni, … Sonja Wipf
Nature (2018-04-04) https://doi.org/gdfwk3
DOI: 10.1038/s41586-018-0005-6 · PMID: 29618821
21. Exploring large vegetation databases to detect temporal trends in species occurrences
Ute Jandt, Henrik von Wehrden, Helge Bruelheide
Journal of Vegetation Science (2011-12) https://doi.org/d8b4jv
DOI: 10.1111/j.1654-1103.2011.01318.x
22. Phantom species: adjusting estimates of colonization and extinction for pseudo-turnover
Jared J. Beck, Bret Larget, Donald M. Waller
Oikos (2018-11) https://doi.org/gfn4pn
DOI: 10.1111/oik.05114
23. sPlot – A new tool for global vegetation analyses
Helge Bruelheide, Jürgen Dengler, Borja Jiménez‐Alfaro, Oliver Purschke, Stephan M. Hennekens, Milan Chytrý, Valério D. Pillar, Florian Jansen, Jens Kattge, Brody Sandel, … Andrei Zverev
Journal of Vegetation Science (2019-04-08) https://doi.org/gfvhkm
DOI: 10.1111/jvs.12710
24. Biodiversity data integration—the significance of data resolution and domain
Christian König, Patrick Weigelt, Julian Schrader, Amanda Taylor, Jens Kattge, Holger Kreft
PLOS Biology (2019-03-18) https://doi.org/c3xz
DOI: 10.1371/journal.pbio.3000183 · PMID: 30883539 · PMCID: PMC6445469
25. Global trait–environment relationships of plant communities
Helge Bruelheide, Jürgen Dengler, Oliver Purschke, Jonathan Lenoir, Borja Jiménez-Alfaro, Stephan M. Hennekens, Zoltán Botta-Dukát, Milan Chytrý, Richard Field, Florian Jansen, … Ute Jandt
Nature Ecology & Evolution (2018-11-19) https://doi.org/gfj595
DOI: 10.1038/s41559-018-0699-8 · PMID: 30455437
26. Big data for forecasting the impacts of global change on plant communities
Janet Franklin, Josep M. Serra-Diaz, Alexandra D. Syphard, Helen M. Regan
Global Ecology and Biogeography (2017-01) https://doi.org/f9hdp3
DOI: 10.1111/geb.12501
27. Achievements and challenges in the integration, reuse and synthesis of vegetation plot data
Susan K. Wiser
Journal of Vegetation Science (2016-09) https://doi.org/ghfnr5
DOI: 10.1111/jvs.12419
28. Managing data locally to answer questions globally: The role of collaborative science in ecology
Isabelle Aubin, Françoise Cardou, Laura Boisvert‐Marsh, Eric Garnier, Manuella Strukelj, Alison D. Munson
Journal of Vegetation Science (2020-04-03) https://doi.org/ggtgsm
DOI: 10.1111/jvs.12864
29. TRY plant trait database – enhanced coverage and open access
Jens Kattge, Gerhard Bönisch, Sandra Díaz, Sandra Lavorel, Iain Colin Prentice, Paul Leadley, Susanne Tautenhahn, Gijsbert D. A. Werner, Tuomas Aakala, Mehdi Abedi, … Christian Wirth
Global Change Biology (2020) https://onlinelibrary.wiley.com/doi/abs/10.1111/gcb.14904
DOI: https://doi.org/10.1111/gcb.14904
30. The relationship between niche breadth and range size of beech ( Fagus ) species worldwide
Qiong Cai, Erik Welk, Chengjun Ji, Wenjing Fang, Francesco M. Sabatini, Jianxiao Zhu, Jiangling Zhu, Zhiyao Tang, Fabio Attorre, Juan A. Campos, … Helge Bruelheide
Journal of Biogeography (2021-03-16) https://doi.org/gjnrnd
DOI: 10.1111/jbi.14074
31. Global functional variation in alpine vegetation
Riccardo Testolin, Carlos Pérez Carmona, Fabio Attorre, Peter Borchardt, Helge Bruelheide, Jiri Dolezal, Manfred Finckh, Sylvia Haider, Andreas Hemp, Ute Jandt, … Borja Jiménez‐Alfaro
Journal of Vegetation Science (2021-04-06) https://doi.org/gjnrnf
DOI: 10.1111/jvs.13000
32. Global fern and lycophyte richness explained: How regional and local factors shape plot richness
Anna Weigand, Stefan Abrahamczyk, Isabelle Aubin, Claudia Bita‐Nicolae, Helge Bruelheide, Cesar I. Carvajal‐Hernández, Daniele Cicuzza, Lucas Erickson Nascimento da Costa, János Csiky, Jürgen Dengler, … Michael Kessler
Journal of Biogeography (2019-12-30) https://doi.org/ggf4gr
DOI: 10.1111/jbi.13782
33. Similar factors underlie tree abundance in forests in native and alien ranges
Masha T. Sande, Helge Bruelheide, Wayne Dawson, Jürgen Dengler, Franz Essl, Richard Field, Sylvia Haider, Mark Kleunen, Holger Kreft, Joern Pagel, … Tiffany M. Knight
Global Ecology and Biogeography (2019-12) https://doi.org/ggftj7
DOI: 10.1111/geb.13027 · PMID: 32063745 · PMCID: PMC7006795
34. Vegetation-plot database of the Carolina Vegetation Survey
Robert K. Peet, Michael T. Lee, M. Forbes Boyle, Thomas R. Wentworth, Michael P. Schafale, Alan S. Weakley
Vegetation databases for the 21st century (2012) https://doi.org/10.7809/b-e.00081
35. VegBank – a permanent, open‐access archive for vegetation‐plot data
Robert K. Peet, M. T. Lee, M. D. Jennings, D. Faber‐Langendoen
Vegetation databases for the 21st century (2012) https://doi.org/10.7809/b-e.00080
36. Terrestrial ecosystem research infrastructures: challenges and opportunities
Abad Chabbi, Henry W Loescher
(2017) http://www.crcnetbase.com/isbn/9781498751339
ISBN: 9781498751339
37. The Global Index of Vegetation-Plot Databases (GIVD): a new resource for vegetation science
Jürgen Dengler, Florian Jansen, Falko Glöckler, Robert K. Peet, Miquel De Cáceres, Milan Chytrý, Jörg Ewald, Jens Oldeland, Gabriela Lopez-Gonzalez, Manfred Finckh, … Nick Spencer
Journal of Vegetation Science (2011-08) https://doi.org/ctx2s7
DOI: 10.1111/j.1654-1103.2011.01265.x
38. Climate-related range shifts - a global multidimensional synthesis and new research directions
J. Lenoir, J.-C. Svenning
Ecography (2015-01) https://doi.org/f6xz9h
DOI: 10.1111/ecog.00967
39. Climatologies at high resolution for the earth’s land surface areas
Dirk Nikolaus Karger, Olaf Conrad, Jürgen Böhner, Tobias Kawohl, Holger Kreft, Rodrigo Wilber Soria-Auza, Niklaus E. Zimmermann, H. Peter Linder, Michael Kessler
Scientific Data (2017-09-05) https://doi.org/gbvksk
DOI: 10.1038/sdata.2017.122 · PMID: 28872642 · PMCID: PMC5584396
40. Global High-Resolution Soil-Water Balance (2019-02-12) /articles/dataset/Global_High-Resolution_Soil-Water_Balance/7707605/3
DOI: 10.6084/m9.figshare.7707605.v3
41. SoilGrids250m: Global gridded soil information based on machine learning
Tomislav Hengl, Jorge Mendes de Jesus, Gerard B. M. Heuvelink, Maria Ruiperez Gonzalez, Milan Kilibarda, Aleksandar Blagotić, Wei Shangguan, Marvin N. Wright, Xiaoyuan Geng, Bernhard Bauer-Marschallinger, … Bas Kempen
PLOS ONE (2017-02-16) https://doi.org/f9qc5p
DOI: 10.1371/journal.pone.0169748 · PMID: 28207752 · PMCID: PMC5313206
42. Heterogeneity-constrained random resampling of phytosociological databases
Attila Lengyel, Milan Chytrý, Lubomír Tichý
Journal of Vegetation Science (2011-02) https://doi.org/dvjzbz
DOI: 10.1111/j.1654-1103.2010.01225.x
43. THE DISTRIBUTION OF THE FLORA IN THE ALPINE ZONE.1
Paul Jaccard
New Phytologist (1912-02) https://doi.org/fvhsjd
DOI: 10.1111/j.1469-8137.1912.tb05611.x
44. A leaf-height-seed (LHS) plant ecology strategy scheme
Mark Westoby
Plant and Soil (1998-02-01) https://doi.org/10.1023/A:1004327224729
DOI: 10.1023/a:1004327224729
45. The world-wide “fast-slow” plant economics spectrum: a traits manifesto
Peter B. Reich
Journal of Ecology (2014-03) https://doi.org/gfc4z9
DOI: 10.1111/1365-2745.12211
46. Uncertainty Quantified Matrix Completion Using Bayesian Hierarchical Matrix Factorization
Farideh Fazayeli, Arindam Banerjee, Jens Kattge, Franziska Schrodt, Peter B. Reich
Institute of Electrical and Electronics Engineers (IEEE) (2014-12) https://doi.org/ghfnw3
DOI: 10.1109/icmla.2014.56
47. BHPMF - a hierarchical Bayesian approach to gap-filling and trait prediction for macroecology and functional biogeography
Franziska Schrodt, Jens Kattge, Hanhuai Shan, Farideh Fazayeli, Julia Joswig, Arindam Banerjee, Markus Reichstein, Gerhard Bönisch, Sandra Díaz, John Dickie, … Peter B. Reich
Global Ecology and Biogeography (2015-12) https://doi.org/f76qw8
DOI: 10.1111/geb.12335
48. Scaling from Traits to Ecosystems
Brian J. Enquist, Jon Norberg, Stephen P. Bonser, Cyrille Violle, Colleen T. Webb, Amanda Henderson, Lindsey L. Sloat, Van M. Savage
Advances in Ecological Research (2015) https://doi.org/ghfnsw
DOI: 10.1016/bs.aecr.2015.02.001
49. The Ecozones of the World
Jürgen Schultz
Springer Science and Business Media LLC (2005) https://doi.org/ft52nn
DOI: 10.1007/3-540-28527-x
50. A global inventory of mountains for bio-geographical applications
Christian Körner, Walter Jetz, Jens Paulsen, Davnah Payne, Katrin Rudmann-Maurer, Eva M. Spehn
Alpine Botany (2016-12-19) https://doi.org/f93fmr
DOI: 10.1007/s00035-016-0182-6
51. Communities and Ecosystems
R. H. Whittaker
Macmillan Publishing Co. Inc. (1975)
52. The economy of nature
Robert E. Ricklefs
W.H. Freeman (2008)
ISBN: 9780716786979
53. EUNIS Habitat Classification: Expert system, characteristic species combinations and distribution maps of European habitats
Milan Chytrý, Lubomír Tichý, Stephan M. Hennekens, Ilona Knollová, John A. M. Janssen, John S. Rodwell, Tomáš Peterka, Corrado Marcenò, Flavia Landucci, Jiří Danihelka, … Joop H. J. Schaminée
Applied Vegetation Science (2020-08-16) https://doi.org/ghf4dn
DOI: 10.1111/avsc.12519
54. TURBOVEG, a comprehensive data base management system for vegetation data
Stephan M. Hennekens, Joop H. J. Schaminée
Journal of Vegetation Science (2001-02-24) https://doi.org/cgmn6m
DOI: 10.2307/3237010
55. Oliverpurschke/Taxonomic_Backbone: First Release Of The Workflow To Generate The Taxonomic Backbone For Splot V.2.1 And Try V.3.0
Oliver Purschke
Zenodo (2017-08-18) https://doi.org/ghf4ph
DOI: 10.5281/zenodo.845445
56. The taxonomic name resolution service: an online tool for automated standardization of plant names
Brad Boyle, Nicole Hopkins, Zhenyuan Lu, Juan Antonio Raygoza Garay, Dmitry Mozzherin, Tony Rees, Naim Matasci, Martha L Narro, William H Piel, Sheldon J Mckay, … Brian J Enquist
BMC Bioinformatics (2013-01-16) https://doi.org/gb8vxz
DOI: 10.1186/1471-2105-14-16 · PMID: 23324024 · PMCID: PMC3554605
57. BioTIME: A database of biodiversity time series for the Anthropocene
Maria Dornelas, Laura H. Antão, Faye Moyes, Amanda E. Bates, Anne E. Magurran, Dušan Adam, Asem A. Akhmetzhanova, Ward Appeltans, José Manuel Arcos, Haley Arnold, … Michael L. Zettler
Global Ecology and Biogeography (2018) https://onlinelibrary.wiley.com/doi/abs/10.1111/geb.12729
DOI: https://doi.org/10.1111/geb.12729
58. Open collaborative writing with Manubot
Daniel S. Himmelstein, Vincent Rubinetti, David R. Slochower, Dongbo Hu, Venkat S. Malladi, Casey S. Greene, Anthony Gitter
PLOS Computational Biology (2019-06-24) https://doi.org/c7np
DOI: 10.1371/journal.pcbi.1007128 · PMID: 31233491 · PMCID: PMC6611653
59. ForestPlots.net: a web application and research tool to manage and analyse tropical forest plot data
Gabriela Lopez-Gonzalez, Simon L. Lewis, Mark Burkitt, Oliver L. Phillips
Journal of Vegetation Science (2011-08) https://doi.org/dz6zb3
DOI: 10.1111/j.1654-1103.2011.01312.x
60. Plot-scale evidence of tundra vegetation change and links to recent summer warming
Sarah C. Elmendorf, Gregory H. R. Henry, Robert D. Hollister, Robert G. Björk, Noémie Boulanger-Lapointe, Elisabeth J. Cooper, Johannes H. C. Cornelissen, Thomas A. Day, Ellen Dorrepaal, Tatiana G. Elumeeva, … Sonja Wipf
Nature Climate Change (2012-04-08) https://doi.org/f223nb
DOI: 10.1038/nclimate1465
61. Database of Masaryk University’s Vegetation Research in Siberia
Milan Chytrý
Biodiversity & Ecology (2012-09-10) https://doi.org/ghgvcp
DOI: 10.7809/b-e.00088
62. The West African Vegetation Database
Marco Schmidt, Thomas Janßen, Stefan Dressler, Karen Hahn, Mipro Hien, Souleymane Konaté, Anne Mette Lykke, Ali Mahamane, Bienvenu Sambou, Brice Sinsin, … Georg Zizka
Biodiversity & Ecology (2012-09-10) https://doi.org/ghgvcf
DOI: 10.7809/b-e.00065
63. BIOTA Southern Africa Biodiversity Observatories Vegetation Database
Gerhard Muche, Ute Schmiedel, Norbert Jürgens
Biodiversity & Ecology (2012-09-10) https://doi.org/ghgvcg
DOI: 10.7809/b-e.00066
64. Vegetation Database of the Okavango Basin
Rasmus Revermann, Amândio Luis Gomes, Francisco Maiato Gonçalves, Johannes Wallenfang, Torsten Hoche, Norbert Jürgens, Manfred Finckh
Phytocoenologia (2016-06-01) https://doi.org/ghgt82
DOI: 10.1127/phyto/2016/0103
65. Zur Vegetationsökologie der Savannenlandschaften im Sahel Burkina Fasos
J. Müller
FB Biologie und Informatik, J.W. Goethe‐Universität Frankfurt a.M (2003)
66. Conventional tree height–diameter relationships significantly overestimate aboveground carbon stocks in the Central Congo Basin
Elizabeth Kearsley, Thales de Haulleville, Koen Hufkens, Alidé Kidimbu, Benjamin Toirambe, Geert Baert, Dries Huygens, Yodit Kebede, Pierre Defourny, Jan Bogaert, … Hans Verbeeck
Nature Communications (2013-08-05) https://doi.org/ghgt8w
DOI: 10.1038/ncomms3269 · PMID: 23912554
67. Responses of plant functional types to environmental gradients in the south-west Ethiopian highlands
Desalegn Wana, Carl Beierkuhnlein
Journal of Tropical Ecology (2011-03-10) https://doi.org/b6mtmx
DOI: 10.1017/s0266467410000799
68. Vegetation Database of Southern Morocco
Manfred Finckh
Biodiversity & Ecology (2012-09-10) https://doi.org/ghgvcq
DOI: 10.7809/b-e.00094
69. {Das Weidepotential im Gutu‐Distrikt (Zimbabwe) – Möglichkeiten und Grenzen der Modellierung unter Verwendung von Landsat TM‐5
C. Samimi
Karlsruher Schriften zur Geographie und Geoökologie (2003)
70. Classification of Korean forests: patterns along geographic and environmental gradients
Tomáš Černý, Martin Kopecký, Petr Petřík, Jong-Suk Song, Miroslav Šrůtek, Milan Valachovič, Jan Altman, Jiří Doležal
Applied Vegetation Science (2015-01) https://doi.org/ghgt8z
DOI: 10.1111/avsc.12124
71. Vegetation of Middle Asia – the project state of art after ten years of survey and future perspectives
Arkadiusz Nowak, Marcin Nobis, Sylwia Nowak, Agnieszka Nobis, Grzegorz Swacha, Zygmunt Kącki
Phytocoenologia (2017-12-01) https://doi.org/gctffg
DOI: 10.1127/phyto/2017/0208
72. Vegetation of the woodland-steppe transition at the southeastern edge of the Inner Mongolian Plateau
Hongyan Liu, Haiting Cui, Richard Pott, Martin Speier
Journal of Vegetation Science (2000-08) https://doi.org/cxr92b
DOI: 10.2307/3246582
73. Combined effects of livestock grazing and abiotic environment on vegetation and soils of grasslands across Tibet
Yun Wang, Gwendolyn Heberling, Eugen Görzen, Georg Miehe, Elke Seeber, Karsten Wesche
Applied Vegetation Science (2017-07) https://doi.org/gbkd6v
DOI: 10.1111/avsc.12312
74. Community assembly during secondary forest succession in a Chinese subtropical forest
Helge Bruelheide, Martin Böhnke, Sabine Both, Teng Fang, Thorsten Assmann, Martin Baruffol, Jürgen Bauhus, François Buscot, Xiao-Yong Chen, Bing-Yang Ding, … Bernhard Schmid
Ecological Monographs (2011-02) https://doi.org/dmwpsm
DOI: 10.1890/09-2172.1
75. Vegetation Database of Sinai in Egypt
Mohamed Hatim
Biodiversity & Ecology (2012-09-10) https://doi.org/ghgvcr
DOI: 10.7809/b-e.00099
76. Eurosiberian meadows at their southern edge: patterns and phytogeography in the NW Tien Shan
Viktoria Wagner
Journal of Vegetation Science (2009-03-25) https://doi.org/ftq2r6
DOI: 10.1111/j.1654-1103.2009.01032.x
77. Plant communities of the southern Mongolian Gobi
Henrik von Wehrden, Karsten Wesche, Georg Miehe
Phytocoenologia (2009-10-21) https://doi.org/ddvj9h
DOI: 10.1127/0340-269x/2009/0039-0331
78. Wetland Vegetation Database of Baikal Siberia (WETBS)
Victor Chepinoga
Biodiversity & Ecology (2012-09-10) https://doi.org/ghgvcs
DOI: 10.7809/b-e.00107
79. Database of Siberian Vegetation (DSV)
Andrei Zverev, Andrey Korolyuk
Biodiversity & Ecology (2012-09-10) https://doi.org/ghmxn2
DOI: 10.7809/b-e.00108
80. SaudiVeg ecoinformatics: Aims, current status and perspectives
Mohamed A. El-Sheikh, Jacob Thomas, Ahmed H. Alfarhan, Abdulrahman A. Alatar, Sivadasan Mayandy, Stephan M. Hennekens, Joop H. J. Schaminėe, Ladislav Mucina, Abdulla M. Alansari
Saudi Journal of Biological Sciences (2017-02) https://doi.org/ghmwh5
DOI: 10.1016/j.sjbs.2016.02.012 · PMID: 28149178 · PMCID: PMC5272952
81. Eastern Pamirs – A vegetation-plot database for the high mountain pastures of the Pamir Plateau (Tajikistan)
Kim André Vanselow
Phytocoenologia (2016-06-01) https://doi.org/f952sp
DOI: 10.1127/phyto/2016/0122
82. Socotra Vegetation Database
Michele De Sanctis, Fabio Attorre
Biodiversity & Ecology (2012-09-10) https://doi.org/ghgvct
DOI: 10.7809/b-e.00111
83. Structural and floristic diversity of mixed tropical rain forest in New Caledonia: new data from the New Caledonian Plant Inventory and Permanent Plot Network (NC-PIPPN)
Thomas Ibanez, Jérôme Munzinger, Gilles Dagostini, Vanessa Hequet, Frédéric Rigault, Tanguy Jaffré, Philippe Birnbaum
Applied Vegetation Science (2014-07) https://doi.org/f57bfw
DOI: 10.1111/avsc.12070
84. Managing biodiversity information: development of New Zealand’s National Vegetation Survey databank
S. K. Wiser, P. J. Bellingham, L. E. Burrows
New Zealand Journal of Ecology (2001) https://www.jstor.org/stable/24055293
85. Species Richness, Forest Structure, and Functional Diversity During Succession in the New Guinea Lowlands
Timothy J. S. Whitfeld, Jesse R. Lasky, Kipiro Damas, Gibson Sosanika, Kenneth Molem, Rebecca A. Montgomery
Biotropica (2014-09) https://doi.org/f6hf36
DOI: 10.1111/btp.12136
86. Database Dry Grasslands in the Nordic and Baltic Region
Jürgen Dengler, Solvita Rūsiņa
Biodiversity & Ecology (2012-09-10) https://doi.org/ghgvcv
DOI: 10.7809/b-e.00114
87. Vegetation-Plot Database of the University of the Basque Country (BIOVEG)
Idoia Biurrun, Itziar García-Mijangos, Juan Campos, Mercedes Herrera, Javier Loidi
Biodiversity & Ecology (2012-09-10) https://doi.org/ghgt9d
DOI: 10.7809/b-e.00121
88. Balkan Dry Grasslands Database
Kiril Vassilev, Zora Dajiś, Renata Cušterevska, Erwin Bergmeier, Iva Apostolova
Biodiversity & Ecology (2012-09-10) https://doi.org/ghgvcw
DOI: 10.7809/b-e.00123
89. The Mediterranean Ammophiletea Database: a comprehensive dataset of coastal dune vegetation
Corrado Marcenò, Borja Jiménez-Alfaro
Phytocoenologia (2016) https://doi.org/ghgt83
DOI: 10.1127/phyto/2016/0133
90. Local temperatures inferred from plant communities suggest strong spatial buffering of climate warming across Northern Europe
Jonathan Lenoir, Bente Jessen Graae, Per Arild Aarrestad, Inger Greve Alsos, W. Scott Armbruster, Gunnar Austrheim, Claes Bergendorff, H. John B. Birks, Kari Anne Bråthen, Jörg Brunet, … Jens-Christian Svenning
Global Change Biology (2013-05) https://doi.org/f24bdd
DOI: 10.1111/gcb.12129 · PMID: 23504984
91. Balkan Vegetation Database: historical background, current status and future perspectives
Kiril Vassilev, Hristo Pedashenko, Alexandra Alexandrova, Alexandar Tashev, Anna Ganeva, Anna Gavrilova, Asya Gradevska, Assen Assenov, Antonina Vitkova, Borislav Grigorov, … Vladimir Vulchev
Phytocoenologia (2016-06-01) https://doi.org/f8sjft
DOI: 10.1127/phyto/2016/0109
92. WetVegEurope: a database of aquatic and wetland vegetation of Europe
Flavia Landucci, Marcela Řezníčková, Kateřina Šumberová, Milan Chytrý, Liene Aunina, Claudia Biţă-Nicolae, Alexander Bobrov, Lyubov Borsukevych, Henry Brisse, Andraž Čarni, … Wolfgang Willner
Phytocoenologia (2015-07-01) https://doi.org/bdmw
DOI: 10.1127/phyto/2015/0050
93. European Mire Vegetation Database: a gap-oriented database for European fens and bogs
Tomáš Peterka, Martin Jiroušek, Michal Hájek, Borja Jiménez-Alfaro
Phytocoenologia (2015-11-01) https://doi.org/f724p4
DOI: 10.1127/phyto/2015/0054
94. Vegetation Database of Albania
Michele De Sanctis, Giuliano Fanelli, Alfred Mullaj, Fabio Attorre
Phytocoenologia (2017-01-01) https://doi.org/ghgt85
DOI: 10.1127/phyto/2017/0178
95. Austrian Vegetation Database
Wolfgang Willner, Christian Berg, Paul Heiselmayer
Biodiversity & Ecology (2012-09-10) https://doi.org/ghgvcx
DOI: 10.7809/b-e.00125
96. Bulgarian Vegetation Database: historic background, current status and future prospects
Iva Apostolova, Desislava Sopotlieva, Hristo Pedashenko, Nikolay Velev, Kiril Vasilev
Biodiversity & Ecology (2012-09-10) https://doi.org/ghgvch
DOI: 10.7809/b-e.00069
97. Swiss Forest Vegetation Database
Thomas Wohlgemuth
Biodiversity & Ecology (2012-09-10) https://doi.org/ghgvcz
DOI: 10.7809/b-e.00131
98. Czech National Phytosociological Database: basic statistics of the available vegetation‐plot data
M. Chytrý, M. Rafajová
Preslia (2003)
99. VegMV – the vegetation database of Mecklenburg-Vorpommern
Florian Jansen, Jürgen Dengler, Christian Berg
Biodiversity & Ecology (2012-09-10) https://doi.org/gftw54
DOI: 10.7809/b-e.00070
100. VegetWeb – the national online-repository of vegetation plots from Germany
Jörg Ewald, Rudolf May, Martin Kleikamp
Biodiversity & Ecology (2012-09-10) https://doi.org/ghgvcj
DOI: 10.7809/b-e.00073
101. German Vegetation Reference Database (GVRD)
Ute Jandt, Helge Bruelheide
Biodiversity & Ecology (2012-09-10) https://doi.org/ghgvc2
DOI: 10.7809/b-e.00146
102. The phytosociological database SOPHY as the basis of plant socio-ecology and phytoclimatology in France
Emmanuel Garbolino, Patrice De Ruffray, Henry Brisse, Gilles Grandjouan
Biodiversity & Ecology (2012-09-10) https://doi.org/ghhn9q
DOI: 10.7809/b-e.00074
103. Hellenic Natura 2000 Vegetation Database (HelNatVeg)
Panayotis Dimopoulos, Ioannis Tsiripidis
Biodiversity & Ecology (2012-09-10) https://doi.org/ghgvc3
DOI: 10.7809/b-e.00177
104. Hellenic Woodland Database
Georgios Fotiadis, Ioannis Tsiripidis, Erwin Bergmeier, Panayotis Dimopolous
Biodiversity & Ecology (2012-09-10) https://doi.org/ghgvc4
DOI: 10.7809/b-e.00178
105. Phytosociological Database of Non-Forest Vegetation in Croatia
Zvjezdana Stancic
Biodiversity & Ecology (2012-09-10) https://doi.org/ghgt9f
DOI: 10.7809/b-e.00180
106. Hungarian Phytosociological database (COENODATREF): sampling methodology, nomenclature and its actual stage
K Lájer, Z. Botta‐Dukát, J. Csiky, F. Horváth, F. Szmorad, I. Bagi, T. Rédei
Annali di Botanica, Nuova Serie (2008)
107. VegItaly: The Italian collaborative project for a national vegetation database
F. Landucci, A. T. R. Acosta, E. Agrillo, F. Attorre, E. Biondi, V. E. Cambria, A. Chiarucci, E. Del Vico, M. De Sanctis, L. Facioni, … R. Venanzoni
Plant Biosystems - An International Journal Dealing with all Aspects of Plant Biology (2012-12) https://doi.org/ghgt8x
DOI: 10.1080/11263504.2012.740093
108. Italian National Vegetation Database (BVN/ISPRA)
Laura Casella, Pietro Massimiliano Bianco, Pierangela Angelini, Emi Morroni
Biodiversity & Ecology (2012-09-10) https://doi.org/ghgvc6
DOI: 10.7809/b-e.00192
109. Nationwide Vegetation Plot Database – Sapienza University of Rome: state of the art, basic figures and future perspectives
Emiliano Agrillo*, Nicola Alessi, Marco Massimi, Francesco Spada, Michele De Sanctis
Phytocoenologia (2017-07-20) https://doi.org/gbsxm9
DOI: 10.1127/phyto/2017/0139
110. Semi-natural Grassland Vegetation Database of Latvia
Solvita Rūsiņa
Biodiversity & Ecology (2012-09-10) https://doi.org/ghgt9g
DOI: 10.7809/b-e.00197
111. Schatten voor de natuur. Achtergronden, inventaris en toepassingen van de Landelijke Vegetatie Databank
J. H. J. Schaminée, J. A. M. Janssen, R. Haveman, S. M. Hennekens, G. B. M. Heuvelink, H. P. J. Huiskes, E. J. Weeda
KNNV Uitgeverij (2006)
112. The Polish Vegetation Database: structure, resources and development
Zygmunt Kącki, Michał Śliwiński
Acta Societatis Botanicorum Poloniae (2012) https://doi.org/f34f3k
DOI: 10.5586/asbp.2012.014
113. Romanian Forest Database: a phytosociological archive of woody vegetation
Adrian Indreica, Pavel Dan Turtureanu, Anna Szabó, Irina Irimia
Phytocoenologia (2017-12-01) https://doi.org/ghgt86
DOI: 10.1127/phyto/2017/0201
114. The Romanian Grassland Database (RGD): historical background, current status and future perspectives
Kiril Vassilev, Eszter Ruprecht, Valeriu Alexiu, Thomas Becker, Monica Beldean, Claudia Biță-Nicolae, Anna Mária Csergő, Iliana Dzhovanova, Eva Filipova, József Pál Frink, … Jürgen Dengler
Phytocoenologia (2018-03-01) https://doi.org/gc79hp
DOI: 10.1127/phyto/2017/0229
115. Vegetation Database Grassland Vegetation of Serbia
Svetlana Aćić, Milicia Petrović, Urban Šilc, Zora Dajić Stevanović
Biodiversity & Ecology (2012-09-10) https://doi.org/ghgt9h
DOI: 10.7809/b-e.00206
116. Lower Volga Valley Phytosociological Database
Alexey Sorokin, Valentin Golub, Kseniya Starichkova, Lyudmila Nikolaychuk, Viktoria Bondareva, Tatyana Ivakhnova
Biodiversity & Ecology (2012-09-10) https://doi.org/ghgt9j
DOI: 10.7809/b-e.00207
117. Vegetation Database of the Volga and the Ural Rivers Basins
Tatiana Lysenko, Olga Kalmykova, Anna Mitroshenkova
Biodiversity & Ecology (2012-09-10) https://doi.org/ghgvc7
DOI: 10.7809/b-e.00208
118. Vegetation Database of Tatarstan
Vadim Prokhorov, Tatiana Rogova, Maria Kozhevnikova
Phytocoenologia (2017-09-27) https://doi.org/ghgt84
DOI: 10.1127/phyto/2017/0172
119. Vegetation Database of Slovenia
Urban Šilc
Biodiversity & Ecology (2012-09-10) https://doi.org/ghgt9k
DOI: 10.7809/b-e.00215
120. Slovak Vegetation Database
Jozef Šibík
Biodiversity & Ecology (2012-09-10) https://doi.org/ghgt9m
DOI: 10.7809/b-e.00216
121. Ukrainian Grasslands Database
Anna Kuzemko
Biodiversity & Ecology (2012-09-10) https://doi.org/ghk7f3
DOI: 10.7809/b-e.00217
122. The Tree Biodiversity Network (BIOTREE-NET): prospects for biodiversity research and conservation in the Neotropics
Luis Cayuela, Lucía Gálvez-Bravo, Ramón Pérez Pérez, Fábio de Albuquerque, Duncan Golicher, Rakan Zahawi, Neptalí Ramírez-Marcial, Cristina Garibaldi, Richard Field, José Rey Benayas, … Regino Zamora
Biodiversity & Ecology (2012-09-10) https://doi.org/ghgvck
DOI: 10.7809/b-e.00078
123. Timberline meadows along a 1000-km transect in NW North America: species diversity and community patterns
Viktoria Wagner, Toby Spribille, Stefan Abrahamczyk, Erwin Bergmeier
Applied Vegetation Science (2014-01) https://doi.org/f5mpvm
DOI: 10.1111/avsc.12045
124. How resilient are northern hardwood forests to human disturbance? An evaluation using a plant functional group approach
I. Aubin, S. Gachet, C. Messier, A. Bouchard
Ecoscience (2007)
125. Vegetation and altitudinal zonation in continental West Greenland
B. Sieg, B. Drees, F. J. A. Daniëls
Meddelelser om Grønland Bioscience (2006)
126. VegBank – a permanent, open-access archive for vegetation-plot data
Robert Peet, Michael Lee, Michael Jennings, Don Faber-Langendoen
Biodiversity & Ecology (2012-09-10) https://doi.org/ghgvcm
DOI: 10.7809/b-e.00080
127. Vegetation-plot database of the Carolina Vegetation Survey
Robert Peet, Michael Lee, Forbes Boyle, Thomas Wentworth, Michael Schafale, Alan Weakley
Biodiversity & Ecology (2012-09-10) https://doi.org/ghgvcn
DOI: 10.7809/b-e.00081
128. The Alaska Arctic Vegetation Archive (AVA-AK)
Donald A. Walker, Amy L. Breen, Lisa A. Druckenmiller, Lisa W. Wirth, Will Fisher, Martha K. Raynolds, Jozef Šibík, Marilyn D. Walker, Stephan Hennekens, Keith Boggs, … Donatella Zona
Phytocoenologia (2016-09-01) https://doi.org/f877ht
DOI: 10.1127/phyto/2016/0128
129. VegPáramo, a flora and vegetation database for the Andean páramo
Gwendolyn Peyre, Henrik Balslev, David Martí, Petr Sklenář, Paul Ramsay, Pablo Lozano, Nidia Cuello, Rainer Bussmann, Omar Cabrera, Xavier Font
Phytocoenologia (2015-07-01) https://doi.org/f7m9cj
DOI: 10.1127/phyto/2015/0045
130. Insights from a large-scale inventory in the southern Brazilian Atlantic Forest
Alexander Christian Vibrans, André Luís de Gasper, Paolo Moser, Laio Zimermann Oliveira, Débora Vanessa Lingner, Lucia Sevegnani
Scientia Agricola (2020) https://doi.org/ghqcn6
DOI: 10.1590/1678-992x-2018-0036
131. Plant Invasions in Protected Areas
Springer Science and Business Media LLC
(2013) https://doi.org/ghgt8v
DOI: 10.1007/978-94-007-7750-7
| GIVD ID | Dataset name | Custodian | Deputy custodian | Nr. open-access plots | Ref |
|---|---|---|---|---|---|
| 00-00-001 | ForestPlots.net | Oliver L. Phillips | Aurora Levesley | 169 | 59 |
| 00-00-003 | SALVIAS | Brian Enquist | Brad Boyle | 3403 | |
| 00-00-004 | Vegetation Database of Eurasian Tundra | Risto Virtanen | 519 | ||
| 00-00-005 | Tundra Vegetation Plots (TundraPlot) | Anne D. Bjorkman | Sarah Elmendorf | 309 | 60 |
| 00-RU-001 | Vegetation Database Forest of Southern Ural | Vasiliy Martynenko | Pavel Shirokikh | 68 | |
| 00-RU-002 | Database of Masaryk University`s Vegetation Research in Siberia | Milan Chytrý | 158 | 61 | |
| 00-RU-003 | Database Meadows and Steppes of Southern Ural | Sergey Yamalov | Mariya Lebedeva | 238 | |
| 00-TR-001 | Forest Vegetation Database of Turkey - FVDT | Ali Kavgacı | 45 | ||
| AF-00-001 | West African Vegetation Database | Marco Schmidt | Georg Zizka | 258 | 62 |
| AF-00-003 | BIOTA Southern Africa Biodiversity Observatories Vegetation Database | Norbert Jürgens | Ute Schmiedel | 1015 | 63 |
| AF-00-006 | SWEA-Dataveg | Miguel Alvarez | Michael Curran | 1675 | |
| AF-00-008 | PANAF Vegetation Database | Hjalmar S. Kühl | TeneKwetche Sop | 884 | |
| AF-00-009 | Vegetation Database of the Okavango Basin | Rasmus Revermann | Manfred Finckh | 378 | 64 |
| AF-BF-001 | Sahel Vegetation Database | Jonas V. Müller | Marco Schmidt | 556 | 65 |
| AF-CD-001 | Forest Database of Central Congo Basin | Kim Sarah Jacobsen | Hans Verbeeck | 140 | 66 |
| AF-ET-001 | Vegetation Database of Ethiopia | Desalegn Wana | Anke Jentsch | 67 | 67 |
| AF-MA-001 | Vegetation Database of Southern Morocco | Manfred Finckh | 621 | 68 | |
| AF-ZW-001 | Vegetation Database of Zimbabwe | Cyrus Samimi | 31 | 69 | |
| AS-00-001 | Korean Forest Database | Tomáš Černý | Jiri Dolezal | 1039 | 70 |
| AS-00-003 | Vegetation of Middle Asia | Arkadiusz Nowak | Marcin Nobis | 314 | 71 |
| AS-00-004 | Rice Field Vegetation Database | Arkadiusz Nowak | 32 | ||
| AS-BD-001 | Tropical Forest Dataset of Bangladesh | Mohammed A.S. Arfin Khan | Fahmida Sultana | 87 | |
| AS-CN-001 | China Forest-Steppe Ecotone Database | Hongyan Liu | Fengjun Zhao | 117 | 72 |
| AS-CN-002 | Tibet-PaDeMoS Grazing Transect | Karsten Wesche | 58 | 73 | |
| AS-CN-003 | Vegetation Database of the BEF China Project | Helge Bruelheide | 24 | 74 | |
| AS-CN-004 | Vegetation Database of the Northern Mountains in China | Zhiyao Tang | 124 | ||
| AS-EG-001 | Vegetation Database of Sinai in Egypt | Mohamed Z. Hatim | 143 | 75 | |
| AS-ID-001 | Sulawesi Vegetation Database | Michael Kessler | 24 | ||
| AS-IR-001 | Vegetation Database of Iran | Jalil Noroozi | Parastoo Mahdavi | 277 | |
| AS-KZ-001 | Database of Meadow Vegetation in the NW Tien Shan Mountains | Viktoria Wagner | 13 | 76 | |
| AS-MN-001 | Southern Gobi Protected Areas Database | Henrik von Wehrden | Karsten Wesche | 1032 | 77 |
| AS-RU-001 | Wetland Vegetation Database of Baikal Siberia (WETBS) | Victor Chepinoga | 9 | 78 | |
| AS-RU-002 | Database of Siberian Vegetation (DSV) | Andrey Korolyuk | Andrei Zverev | 3634 | 79 |
| AS-RU-004 | Database of the University of Münster - Biodiversity and Ecosystem Research Group’s Vegetation Research in Western Siberia and Kazakhstan | Norbert Hölzel | Wanja Mathar | 207 | |
| AS-SA-001 | Vegetation Database of Saudi Arabia | Mohamed Abd El-Rouf Mousa El-Sheikh | 711 | 80 | |
| AS-TJ-001 | Eastern Pamirs | Kim André Vanselow | 221 | 81 | |
| AS-TW-001 | National Vegetation Database of Taiwan | Ching-Feng Li | Chang-Fu Hsieh | 912 | |
| AS-YE-001 | Socotra Vegetation Database | Michele De Sanctis | Fabio Attorre | 236 | 82 |
| AU-AU-002 | AEKOS | Ben Sparrow | 10976 | 36 | |
| AU-NC-001 | New Caledonian Plant Inventory and Permanent Plot Network (NC-PIPPN) | Jérôme Munzinger | Philippe Birnbaum | 98 | 83 |
| AU-NZ-001 | New Zealand National Vegetation Databank | Susan K. Wiser | 1127 | 84 | |
| AU-PG-001 | Forest Plots from Papua New Guinea | Timothy J.S. Whitfeld | George D. Weiblen | 60 | 85 |
| EU-00-002 | Nordic-Baltic Grassland Vegetation Database (NBGVD) | Jürgen Dengler | Łukasz Kozub | 54 | 86 |
| EU-00-011 | Vegetation-Plot Database of the University of the Basque Country (BIOVEG) | Idoia Biurrun | Itziar García-Mijangos | 2142 | 87 |
| EU-00-013 | Balkan Dry Grasslands Database | Kiril Vassilev | Armin Macanović | 269 | 88 |
| EU-00-016 | Mediterranean Ammophiletea Database | Corrado Marcenò | Borja Jiménez-Alfaro | 783 | 89 |
| EU-00-017 | European Coastal Vegetation Database | John A.M. Janssen | 356 | ||
| EU-00-018 | The Nordic Vegetation Database | Jonathan Lenoir | Jens-Christian Svenning | 1735 | 90 |
| EU-00-019 | Balkan Vegetation Database | Kiril Vassilev | Hristo Pedashenko | 484 | 91 |
| EU-00-020 | WetVegEurope | Flavia Landucci | 127 | 92 | |
| EU-00-022 | European Mire Vegetation Database | Tomáš Peterka | Martin Jiroušek | 2560 | 93 |
| EU-AL-001 | Vegetation Database of Albania | Michele De Sanctis | Giuliano Fanelli | 31 | 94 |
| EU-AT-001 | Austrian Vegetation Database | Wolfgang Willner | Christian Berg | 2310 | 95 |
| EU-BE-002 | INBOVEG | Els De Bie | 119 | ||
| EU-BG-001 | Bulgarian Vegetation Database | Iva Apostolova | Desislava Sopotlieva | 160 | 96 |
| EU-CH-005 | Swiss Forest Vegetation Database | Thomas Wohlgemuth | 2134 | 97 | |
| EU-CZ-001 | Czech National Phytosociological Database | Milan Chytrý | Ilona Knollová | 1287 | 98 |
| EU-DE-001 | VegMV | Florian Jansen | Christian Berg | 15 | 99 |
| EU-DE-013 | VegetWeb Germany | Florian Jansen | Jörg Ewald | 587 | 100 |
| EU-DE-014 | German Vegetation Reference Database (GVRD) | Ute Jandt | Helge Bruelheide | 762 | 101 |
| EU-DK-002 | National Vegetation Database of Denmark | Jesper Erenskjold Moeslund | Rasmus Ejrnæs | 332 | |
| EU-ES-001 | Iberian and Macaronesian Vegetation Information System (SIVIM) - Wetlands | Aaron Pérez-Haase | Xavier Font | 580 | |
| EU-FR-003 | SOPHY | Emmanuel Garbolino | Patrice De Ruffray | 7986 | 102 |
| EU-GB-001 | UK National Vegetation Classification Database | John S. Rodwell | 3182 | ||
| EU-GR-001 | KRITI | Erwin Bergmeier | 22 | ||
| EU-GR-005 | Hellenic Natura 2000 Vegetation Database (HelNatVeg) | Panayotis Dimopoulos | Ioannis Tsiripidis | 620 | 103 |
| EU-GR-006 | Hellenic Woodland Database | Ioannis Tsiripidis | Georgios Fotiadis | 17 | 104 |
| EU-HR-001 | Phytosociological Database of Non-Forest Vegetation in Croatia | Zvjezdana Stančić | 193 | 105 | |
| EU-HR-002 | Croatian Vegetation Database | Željko Škvorc | Daniel Krstonošić | 585 | |
| EU-HU-003 | CoenoDat Hungarian Phytosociological Database | János Csiky | Zoltán Botta-Dukát | 46 | 106 |
| EU-IT-001 | VegItaly | Roberto Venanzoni | Flavia Landucci | 754 | 107 |
| EU-IT-010 | Vegetation database of Habitats in the Italian Alps – HabItAlp | Laura Casella | Pierangela Angelini | 247 | 108 |
| EU-IT-011 | Vegetation-Plot Database Sapienza University of Rome (VPD-Sapienza) | Emiliano Agrillo | Fabio Attorre | 967 | 109 |
| EU-LT-001 | Lithuanian Vegetation Database | Valerijus Rašomavičius | Domas Uogintas | 81 | |
| EU-LV-001 | Semi-natural Grassland Vegetation Database of Latvia | Solvita Rūsiņa | 369 | 110 | |
| EU-MK-001 | Vegetation Database of the Republic of Macedonia | Renata Ćušterevska | 28 | ||
| EU-NL-001 | Dutch National Vegetation Database | Stephan M. Hennekens | Joop H.J. Schaminée | 1098 | 111 |
| EU-PL-001 | Polish Vegetation Database | Zygmunt Kącki | Grzegorz Swacha | 692 | 112 |
| EU-RO-007 | Romanian Forest Database | Adrian Indreica | Pavel Dan Turtureanu | 166 | 113 |
| EU-RO-008 | Romanian Grassland Database | Eszter Ruprecht | Kiril Vassilev | 82 | 114 |
| EU-RS-002 | Vegetation Database Grassland Vegetation of Serbia | Svetlana Aćić | Zora Dajić Stevanović | 217 | 115 |
| EU-RU-002 | Lower Volga Valley Phytosociological Database | Valentin Golub | Andrey Chuvashov | 383 | 116 |
| EU-RU-003 | Vegetation Database of the Volga and the Ural Rivers Basins | Tatiana Lysenko | 174 | 117 | |
| EU-RU-011 | Vegetation Database of Tatarstan | Vadim Prokhorov | Maria Kozhevnikova | 206 | 118 |
| EU-SI-001 | Vegetation Database of Slovenia | Urban Šilc | Filip Küzmič | 1029 | 119 |
| EU-SK-001 | Slovak Vegetation Database | Milan Valachovič | Jozef Šibík | 2394 | 120 |
| EU-UA-001 | Ukrainian Grasslands Database | Anna Kuzemko | Yulia Vashenyak | 301 | 121 |
| EU-UA-006 | Vegetation Database of Ukraine and Adjacent Parts of Russia | Viktor Onyshchenko | Vitaliy Kolomiychuk | 96 | |
| NA-00-002 | Tree Biodiversity Network (BIOTREE-NET) | Luis Cayuela | 241 | 122 | |
| NA-CA-003 | Database of Timberline Vegetation in NW North America | Viktoria Wagner | Toby Spribille | 63 | 123 |
| NA-CA-004 | Understory of Sugar Maple Dominated Stands in Quebec and Ontario (Canada) | Isabelle Aubin | 13 | 124 | |
| NA-CA-005 | Boreal Forest of Canada | Philippe Marchand | Yves Bergeron | 57 | |
| NA-GL-001 | Vegetation Database of Greenland | Birgit Jedrzejek | Fred J.A. Daniëls | 441 | 125 |
| NA-US-002 | VegBank | Robert K. Peet | Michael T. Lee | 14965 | 126 |
| NA-US-006 | Carolina Vegetation Survey Database | Robert K. Peet | Michael T. Lee | 3263 | 127 |
| NA-US-014 | Alaska-Arctic Vegetation Archive | Donald A. Walker | Amy Breen | 771 | 128 |
| SA-00-002 | VegPáramo | Gwendolyn Peyre | Xavier Font | 2010 | 129 |
| SA-AR-002 | Vegetation Database of Central Argentina | Melisa Giorgis | Alicia T.R. Acosta | 86 | |
| SA-BO-003 | Bolivia Forest Plots | Michael Kessler | Sebastian Herzog | 44 | |
| SA-BR-002 | Forest Inventory, State of Santa Catarina, Brazil (IFFSC Project) | Alexander Christian Vibrans | André Luís de Gasper | 1561 | 130 |
| SA-BR-003 | Grasslands of Rio Grande do Sul, Brazil | Eduardo Vélez-Martin | Valério D. Pillar | 306 | |
| SA-BR-004 | Grassland Database of Campos Sulinos | Gerhard E. Overbeck | Valério D. Pillar | 147 | |
| SA-CL-002 | SSAForests_Plots_db | Alvaro G. Gutiérrez | 155 | ||
| SA-CL-003 | Chilean Park Transects - Fondecyt 1040528 | Aníbal Pauchard | Alicia Marticorena | 44 | 131 |
| SA-EC-001 | Ecuador Forest Plot Database | Jürgen Homeier | 166 |
| Variable | Range/Levels | Unit of Measurement | Nr. of plots with information | Type |
|---|---|---|---|---|
| GIVD_ID | 95104 | n | ||
| Dataset | 95104 | n | ||
| Continent | Africa, Asia, Europe, North America, Oceania, South America | 95104 | n | |
| Country | 95104 | n | ||
| Biome | Alpine, Boreal zone, Dry midlatitudes, Dry tropics and subtropics, Polar and subpolar zone, Subtropics with year-round rain, Subtropics with winter rain, Temperate midlatitudes, Tropics with summer rain, Tropics with year-round rain | 95104 | n | |
| Date_of_recording | 1888-07-05 - 2015-02-03 | dd-mm-yyyy | 80085 | d |
| Latitude | -54.82303 - 80.149116 | ° (WGS84) | 95104 | q |
| Longitude | -162.741433 - 176.4221 | ° (WGS84) | 95104 | q |
| Location_uncertainty | 1 - 2750 | m | 95075 | q |
| Releve_area | 0.03 - 40000 | m2 | 67022 | q |
| Plant_recorded | All vascular plants, All trees & dominant understory, Dominant trees, Only dominant species, Dominant woody plants >= 2.5 cm dbh, All woody plants, Woody plants >= 1 cm dbh, Woody plants >= 2.5 cm dbh, Woody plants >= 5 cm dbh, Woody plants >= 10 cm dbh, Woody plants >= 20 cm dbh, Woody plants >= 1 m height, Not specified | 95104 | n | |
| Elevation | -30 - 5960 | m a.s.l. | 62968 | q |
| Aspect | 1 - 360 | ° | 42178 | q |
| Slope | 0 - 90 | ° | 51246 | q |
| is_forest | FALSE = 45735; TRUE = 38282 | 84017 | b | |
| ESY | 39632 | n | ||
| Naturalness | 1 = Natural, 2 = Semi-natural | 60192 | o | |
| Forest | FALSE = 36282; TRUE = 33170 | 69452 | b | |
| Shrubland | FALSE = 58245; TRUE = 11207 | 69452 | b | |
| Grassland | FALSE = 33800; TRUE = 35652 | 69452 | b | |
| Wetland | FALSE = 59196; TRUE = 10256 | 69452 | b | |
| Sparse_vegetation | FALSE = 66177; TRUE = 3275 | 69452 | b | |
| Cover_total | 1 - 990 | % | 19407 | q |
| Cover_tree_layer | 0.5 - 150 | % | 12094 | q |
| Cover_shrub_layer | 0.5 - 170 | % | 16804 | q |
| Cover_herb_layer | 0.2 - 199 | % | 29668 | q |
| Cover_moss_layer | 1 - 100 | % | 9681 | q |
| Cover_lichen_layer | 1 - 90 | % | 708 | q |
| Cover_algae_layer | 1 - 100 | % | 41 | q |
| Cover_litter_layer | 1 - 107 | % | 3161 | q |
| Cover_bare_rocks | 1 - 100 | % | 2747 | q |
| Cover_cryptogams | 1 - 90 | % | 772 | q |
| Cover_bare_soil | 0 - 99 | % | 2746 | q |
| Height_trees_highest | 1 - 99 | m | 8220 | q |
| Height_trees_lowest | 1 - 90 | m | 447 | q |
| Height_shrubs_highest | 0.1 - 9.9 | m | 3389 | q |
| Height_shrubs_lowest | 0.1 - 9 | m | 263 | q |
| Height_herbs_average | 0.1 - 600 | cm | 5901 | q |
| Height_herbs_lowest | 1 - 150 | cm | 490 | q |
| Height_herbs_highest | 1 - 600 | cm | 1083 | q |
| SoilClim_PC1 | -6.233 - 8.172 | 95104 | q | |
| SoilClim_PC2 | -4.824 - 15.466 | 95104 | q | |
| Resample_1 | FALSE = 45317; TRUE = 49787 | 95104 | b | |
| Resample_2 | FALSE = 45293; TRUE = 49811 | 95104 | b | |
| Resample_3 | FALSE = 45315; TRUE = 49789 | 95104 | b | |
| Resample_1_consensus | FALSE = 41842; TRUE = 53262 | 95104 | b |